Loading...
Loading...
Loading...
Loading...
Loading...
Loading...
Loading...
Loading...
Loading...
Loading...
Loading...
Loading...
Loading...
Use the Collaboration Site to store and share large files.
Collaboration Site allows you to share files large files, for example, your project files and deliverables for a managed service engagement. Access to the Collaboration Site is based on permissions and only authorized users can access the site.
After your account has been set up, only top-level administrators are granted access to the Collaboration Site. If you cannot view this module, contact your administrator or your SoftwareOne Account Manager.
Follow these steps to grant access through the Collaboration Site:
From the main menu, navigate to Other tools > Collaboration Site.
In the Actions column, select the ellipsis ( ••• ) and choose Manage permissions.
On the Manage Permissions page, make changes as necessary. You can update permissions, assign multiple users to a workspace, and delete a user to remove their access rights.
Click Save.
The Transactions workspace within the Collaboration Site contains files attached to the orders placed through the Client Portal. Only those users who have access to the folder can view and download files.
Follow these steps to enable access to the Transactions workspace:
Navigate to Setup > User Management.
On the User Management page, locate the user that requires access to the Transactions workspace, and select View in the Actions column. The user details page is displayed.
Under Feature Permissions, navigate to Collaboration Site and enable View Storefront Documents.
Save your changes.
Authorized users can easily download a folder and its contents from the Collaboration Site.
To download a file or folder
Navigate to the Collaboration Site. The workspaces that you are authorized to access are displayed.
Choose your workspace and do the following:
To download the entire folder, select the ellipsis ( ••• ) and choose Download. You can also select the Sharing menu in the breadcrumb and select Download to download your current open folder directory.
To download a file, open the folder, locate the file, and select Download.
Your download will begin. Note that it might take some time for the large files to download completely.
Authorized users can create new folders within the Collaboration Site.
To create a new folder:
Select Add New Folder and provide a unique name for your folder.
Select Create. The new folder is created and displayed as a child folder within the main folder.
You can upload a single or multiple files to a new folder.
Before uploading a file, ensure that the file names are unique. If a file with the same name already exists, you can overwrite the file by selecting the Overwrite existing files checkbox. Note that you can upload files up to 50 MB in size. There's no limit to the number of files in a single folder.
To upload a file, select the Upload file option. Then., choose the file that you want to upload.
Follow these steps to rename a file or folder:
Navigate to the folder or file that you want to rename.
In the Actions column, select the ellipsis ( ••• ) and choose Rename
Provide a unique name and save your changes.
Follow these steps to delete a file or folder
Navigate to the folder or the file that you want to delete.
In the Actions column, select the ellipsis ( ••• ) and choose Delete.
Confirm that you want to delete the file or folder.
Follow these steps to move a file or folder to a different location:
Select the checkboxes next to the file/folder that you want to move.
Select Move.
Select the new location or the target directory.
Note that if the file or the directory already exists in your chosen location, a message is displayed.
View predefined dashboards or customize your dashboard to show data that is of interest to you.
The Client Portal contains predefined dashboards that you can use to view the data. You can also create your custom dashboards.
The dashboards mainly consist of tiles displaying different information such as the data about your preferred statistic, such as the number of invoices, orders, quotes, and more.
Each tile can have multiple functionalities, for example, they can display data and act as a shortcut. You can also configure the size of a tile and define how data is displayed in certain tiles. If there is no data for a specific tile, a message is displayed in the tile.
Follow these steps to access the predefined dashboards:
From the main menu, navigate to Other tools > Dashboard. The Dashboard page opens.
From Choose a template, choose the dashboard you want to view. The following dashboards are available:
Finance
Available to all users.
Procurement
Available to all users.
Software Asset Management (SAM)
Available only if you've purchased SAMSimple.
Cloud
Available only if you've purchased Cloud Spend Management.
You can create new dashboards, customize your dashboards, or remove a dashboard. Customized dashboards are displayed under Choose a template.
Follow these steps to create a new dashboard:
On the Dashboard page, click Create New.
On the Create New Dashboard page, click New.
Provide a name for your custom dashboard and then in Add a tile, choose the tile that you want to add.
Click Save.
Follow these steps to customize a dashboard:
On the Dashboard page, select Edit this dashboard. The dashboard opens in the edit mode.
Make changes as necessary.
To remove a tile from your dashboard, select Remove. If the tile is too small to accommodate the full button, you'll only see the trashcan icon.
To configure a tile, select Configure or the cogwheel icon and then choose the configuration options.
Save your customized dashboard to make it available under Choose a template.
Each tile has different configuration options relevant to the function it serves. You can have multiple instances of the same tile with different configurations (for example: Invoices for last month and Invoices for the last six months).
Follow these steps to remove a dashboard permanently
On the Dashboard page, click Edit this dashboard.
Click Delete.
Select the checkbox to grant consent.
Click Delete to confirm the deletion.
After you've added a tile to the dashboard, you can move or resize it. Most of the tiles can be resized from their default size.
You can resize a tile by dragging the tile border. To move a tile, drag the whole tile.
Report on your monthly Microsoft Service Provider License Agreements (SPLA).
The Microsoft Services Provider License Agreement (SPLA) is a license agreement for organizations that want to offer their customers hosted software services, including web services, database services, and applications. Microsoft issues a monthly invoice to the service provider that corresponds to the use of the software. Accordingly, the provider must provide adequate reporting so that monthly usage can be reliably recorded.
The SoftwareOne Client Portal has a custom Service Provider Reporting module that offers advanced management and allows you to create monthly reports for your Microsoft SPLA contract.
You can access the module by navigating to the main menu of the Client Portal and selecting Marketplace > Service Provider Reporting.
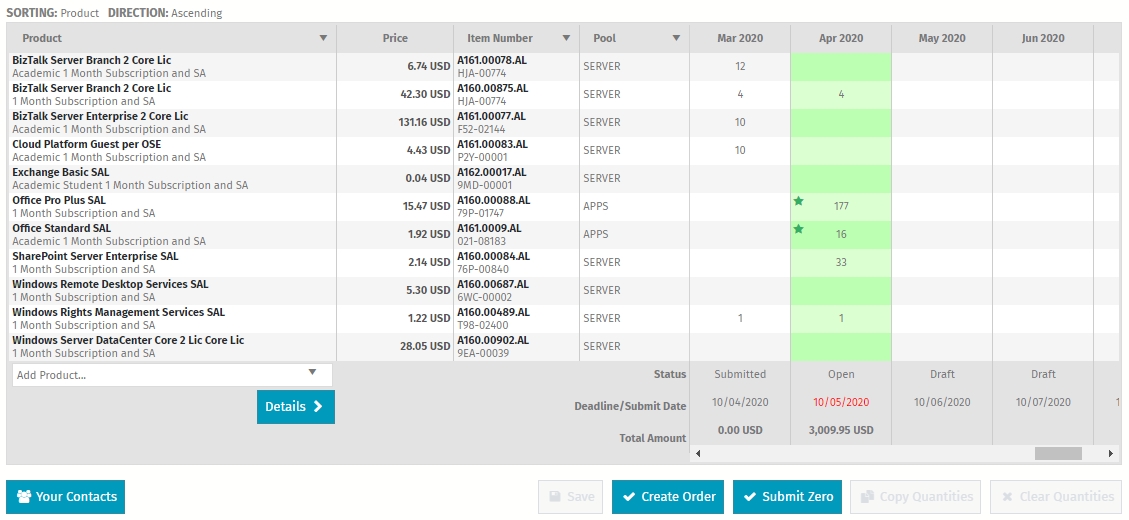
The Service Provider Reporting page contains options that allow you to edit product quantities and view your contracts. The page also displays products within each contract, along with the prices, item numbers, and pool. Clicking a product opens up its Product Detail page.
On the Service Provider Reporting page:
The highlighted column represents the current month.
The Open status means that this report hasn't been transmitted yet.
The Deadline/Submit Date represents the delivery date by which the report must be submitted. The reporting window opens on the 28th of the reporting month and closes on the 10th of the following month. Orders must be placed during that time and for the given period. If this date is exceeded, it will be highlighted in red. As a result, entries in future months can only be saved as a draft and cannot be transferred.
A green star represents changes to quantities after importing an SPLA template.
On the Service Provider Reporting, you can also view details of the past reports that have already been submitted, for example, the date of the last order, the day of the last invoice, or the PO reference. To view such information, click Details.
You can view your contracts using the Contracts option on the Service Provider Reporting page.
After selecting a contact, click the magnifying glass icon to view the details associated with your selected contract. When you click the magnifying glass icon, the License Agreement Details page opens.
You can edit the quantity of products using the Edit All Contracts Quantities option. Follow these steps to edit the quantity:
On the Service Provider Reporting page, click Edit All Contracts Quantities.
In Edit All Contracts Quantities, click Download Template. When you click this button, an Excel file is downloaded to your system.
Open the downloaded file and provide the information in the Open Quantities and Comment columns.
Save your file and upload it to the Client Portal. To upload the file, click Import Template in Edit All Contracts Quantities.
The report view reloads automatically to display the updated data. All changes in the quantities after importing the SPLA template are marked with a green star and can also be checked in Latest Import Changes Applied.
Downloading the template might take a few seconds. If any of your contracts are outdated, the template will include the oldest month still open. Ensure all previous months are updated and sent before performing this action for the current month.
Follow these steps to adjust the quantity:
On the Service Provider Reporting page, click within a cell. The background color of the cell changes and a Details window containing details of the data set opens.
Enter the new value in the cell and add your comments in the Comments field.
Click Save to update your changes.
When you save your changes, the yellow-colored fields will change to their original color. This creates or updates a draft for the revised month, which can be edited until it is transferred via Create Order.
If you add your comments, the red marking in the cell will imply that a comment has been entered into this field. If you hover your mouse, the comment will be displayed. When you are finished, select another line, and the quantity will be accepted. The cell that has now been edited is highlighted in yellow as a sign that changes have been made but have not been saved yet.
You can add new products from the SPLA catalog using the Add Product option (available under the Product column).
Follow these steps to add a new product:
On the Service Provider Reporting page, click Add Product.
Select a product from the list or type the product name. The product is added.
Click Save. The feature creates or updates a draft for the revised month, which can be edited until it is transferred via Create Order.
The Copy Quantities option allows you to copy the values from the previous month.
To copy the quantities, select the cell for the month to be filled out to select it and click Copy Quantities. After clicking the button, the values from the previous month are transferred.
To clear the values, click Clear Quantities.
The Save option is enabled when you make any changes, for example, if you add comments or new products.
The action creates a draft that can still be edited. Draft numbers are always stored and can be changed until the final submission. The orders that are not submitted or completed are marked as Draft in the bottom line of the table as well.
The Create Order option allows you to move your changes to the shopping cart.
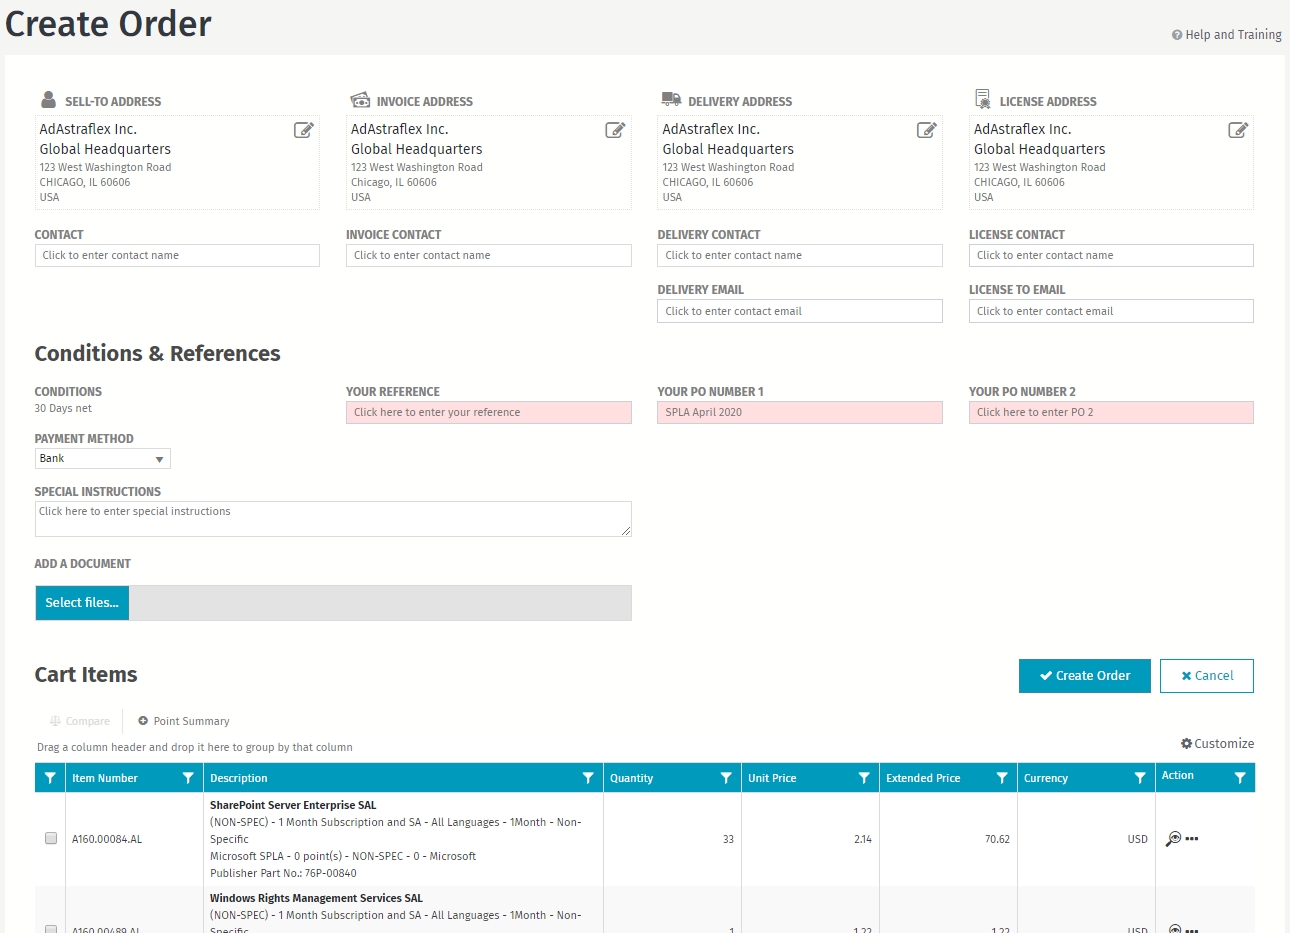
Before clicking Create Order, make sure to review the address details and contact persons. Personal references or order numbers can also be stored, and related documents can be attached.
The PO Number 1 field is blocked from editing because the SPLA month year is automatically displayed. The payment method and special instructions can be transmitted.
After checking the specified details and products in the shopping cart, the order can be submitted. Once you've placed the order, the color of the submitted month in the overview changes from green to gray, and the status changes to Submitted.
It means that your request has been sent to the appropriate team. If there are inconsistencies, or if there is a better cost model that you could use, they will contact you.
The Submit Zero option allows you to confirm that no usage statement should be sent for a given month.
For security reasons, the page will open a new dialog window asking you to confirm the action. Then the column background of the submitted month in the overview changes from green to gray, and the status changes to Reported Zero.
Get detailed analysis of your Office365 spend.
Office365 Consumption provides users with detailed Office365 spend analysis. The data is based on the billing data that is fetched daily.
Using Office365 Consumption, you can access multiple analytic reports and browse consumption cost information through interactive charts. The analysis is extended by leveraging information from the other Client Portal modules. You can also analyze spend per Custom Group or Budget.
To access Office365 Consumption:
Navigate to Other tools > Consumption overview. The Consolidated Consumption page displays.
From the View menu, select SaaS Office365 Consumption Details or Office365 Billing Consumption Details (Preview).
You can visualize and analyze your Office 365 EA and Office 365Simple spend.
Each Azure Active Directory user and subscription is treated like a resource. You can assign it to a custom group, add tags, or split the quantity between different business units.
The SaaS Office365 Consumption Details Report report displays the cost or quantity data.
The cost data always reports the initial monthly cost on the first day of the month and additional costs due to subscription updates on the day it happened. The cost data is calculated in a single currency.
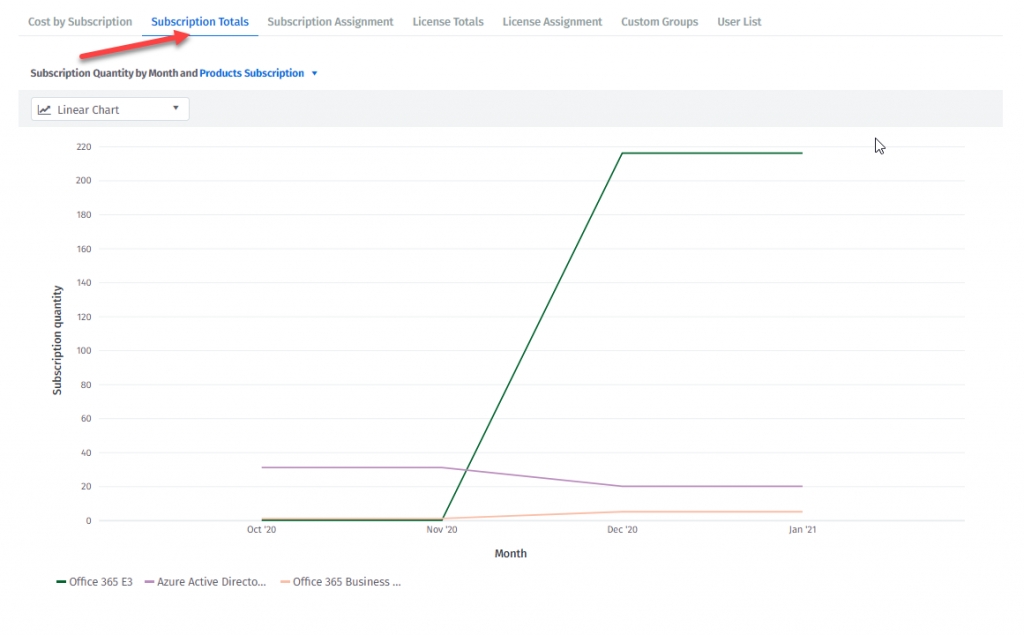
The quantity data shows the maximum number of subscriptions by product subscription per month.
The cost data for the Office 365Simple Multiple Agreements Tenant uses the average price calculated in a single currency. The average price is calculated on the first day of the month and on every subscription update.
To check the billing data per agreement, use the Office365 Billing Consumption Details (Preview) report or see the Billing tab under Cloud Subscriptions.
If your Office365 tenant has subscriptions in multiple currencies, the Client Portal will only display the consumption data in the default currency of the portal. Multicurrency calculations are not supported for Office365 consumption.
The cost data for Office365 EA Tenant uses the average price set manually in the Price List.
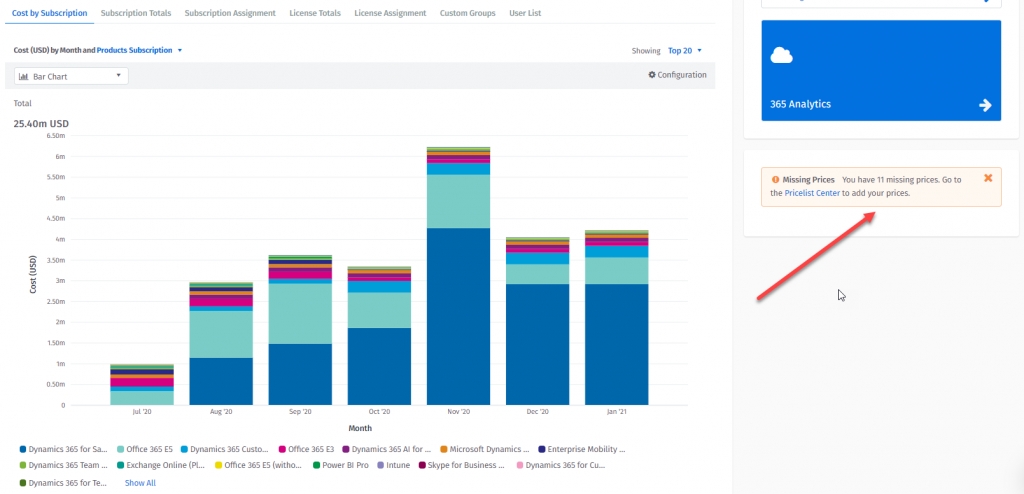
If the price for a subscription is not set, an information banner is displayed as shown in the following image:
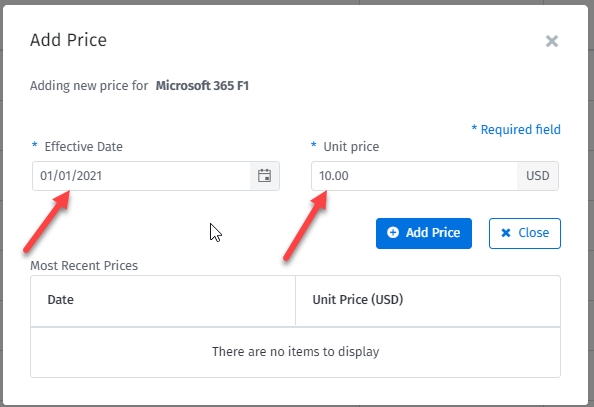
The price in the Price List Center is set for every subscription per month and the average calculation has to be done manually. All missing prices are visible under Missing Prices. If the historical quantity data is available, the cost data is recalculated starting from the Effective Date.
The cost data for an Office 365 Tenant with mixed purchase agreements (that is, Office 365Simple and EA) uses an average price calculation based on the Office 365Simple prices only.
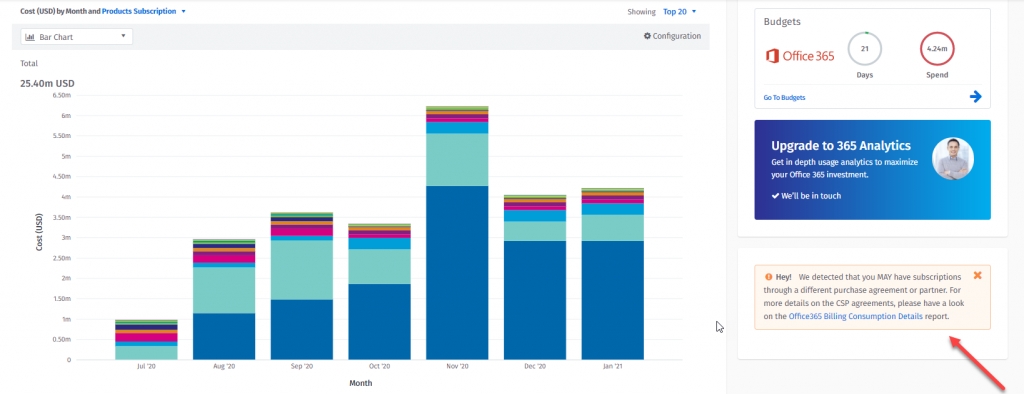
The Client Portal doesn't support setting custom prices for the subscriptions purchased through the Office 365 EA agreement. For Office 365 Tenants with mixed purchase agreements, an information banner is displayed.
Azure Active Directory users and subscriptions are treated like resources. Azure Active Directory user resource cost, is a sum of costs of all subscriptions assigned to this user.
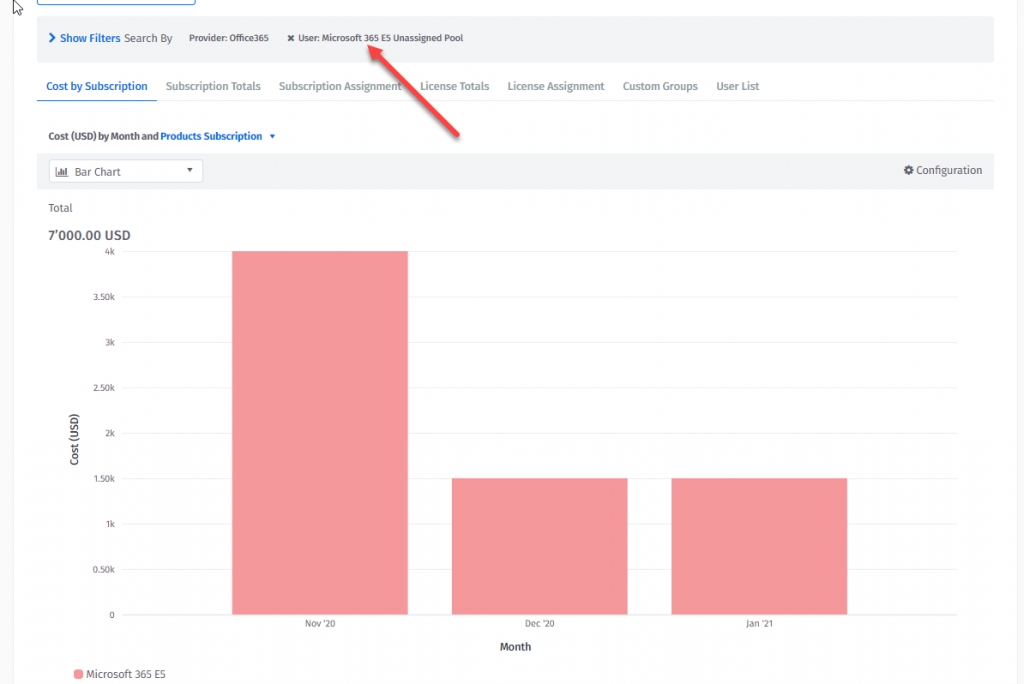
Subscription resource cost is the cost of all subscriptions that are not assigned to any Azure Active Directory user (Subscription resource has a name set to Subscription name and “Unassigned Pool” suffix).
The Client Portal offers a large number of reports, allowing you to gain valuable insights into your software asset inventory, resource utilization, cloud consumption, renewals, and more.
You can set up a report using the Quick Reports feature or create a customized report using the available report options. You can also:
Export your reports to any of the available formats.
Run and publish reports only once, daily, weekly, or monthly.
Modify report configuration and existing schedule.
Delete reports.
Pause or resume scheduled reports.
View, search, and share reports.
Create report templates.
You can access the Reports page by navigating to the main menu and selecting Other tools > Reports.
Access to the Reports feature depends on your user permissions and role. Additionally, each report type has specific permissions, and reports are generated with their owner's permission
The Quick Reports tab displays all report options that are available to you and allows you to create a new report based on predefined filters quickly. Note that by default, all quick reports are created as Run Once only.
Follow these steps to create a quick report:
From the main menu, navigate to Other tools > Reports.
On the Quick Reports tab, navigate to the report group and choose the reporting template from the menu.
Select Create. The Create Quick Report page opens.
Review the report summary, name, and delivery method. Note that you can adjust the details and apply filters as needed.
Select Finish. Your report is created and a confirmation message is displayed.
Watch the following video tutorial on how to create a Software Asset Inventory quick report:
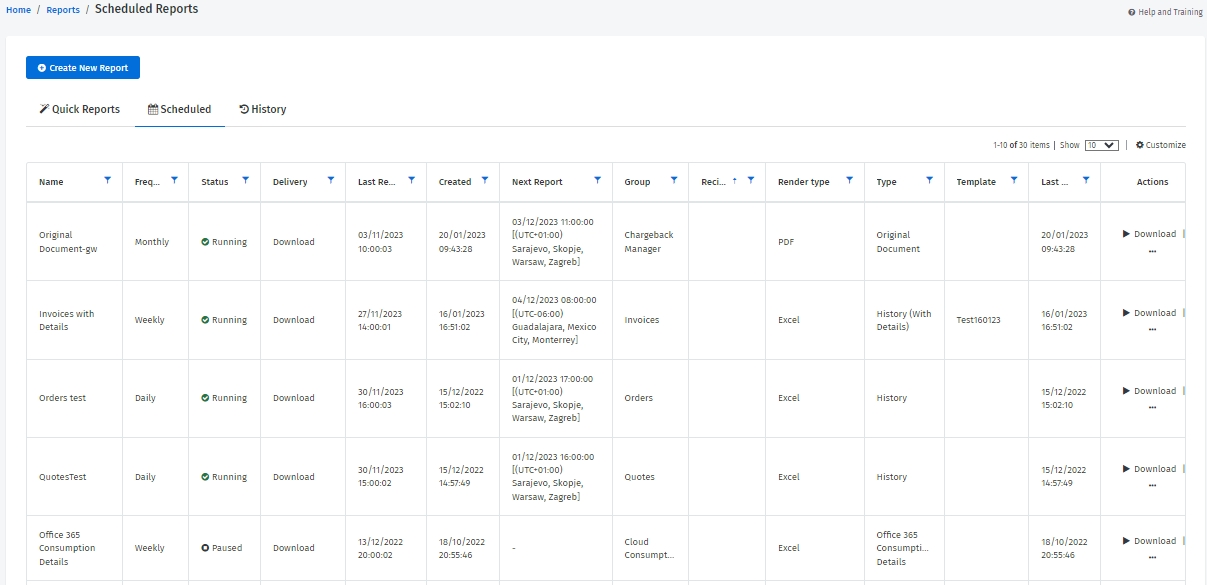
The Scheduled tab displays the scheduled report configurations and allows you to edit, run, pause, resume, preview, and delete reports.
Note that you must have the SCHEDULED_REPORTING permission to access this tab.
On this tab, you can view the following details:
Name - The name of the report.
Frequency - Indicates if this is a Daily, Weekly, or Monthly report. Off means that recurrence for the report is not yet defined (this is only possible when the report has been created using old reporting).
Status - Indicates whether the report is being generated or paused.
Delivery - The delivery format for the report.
Last Report - The time when the report was last generated.
Created - The date and time when the report was created.
Next Report - The time when the next report will be generated.
Group - The type of the report group.
Recipients - The email address of the recipient.
Render type - The format of the report.
Type - The type of report.
Template - Indicates whether any template has been selected for the report.
Last Modified - The date and time of the last update of the report configuration (in the local time zone).
Actions - The list of actions for the report.
Follow these steps to create a new report:
When creating a new report, the available options vary based on the type of report. Some reports can be run once only, whereas others can be run once or scheduled periodically. Similarly, some reports support report templates, while others don't. For each report type, you can view the available options when you are creating the report.
Navigate to the Reports page (Other tools > Reports) and click Create New Report.
Select the report group and the type of report, and then choose the format in which you wish to generate the report. Note that the format varies depending on the report.
Choose the filters and select Next. To set additional filters (related to dates and number formatting), select Show more formatting options.
Select the schedule type. You can run the report once, daily, weekly, or monthly. Note that for the reports that can be run once only, the Run Once option is selected by default and you cannot change it. All other options are unavailable.
Select the date range for the data you want to include in the report.
Select an existing template from Saved Templates or create a new template. Note that the Saved Templates option is displayed only if the report supports templates. If the report does support templates, but you choose not to apply the template, the system will use the default template.
Provide a unique Report Name and choose the report delivery method.
Select Finish. A confirmation message is displayed.
Depending on your chosen report schedule, the Scheduled Reports page or the Reports History page is displayed. Note that all Run Once reports are triggered immediately.
You can update the configuration of a scheduled report, except the report group and the type of report.
To update a report, select the actions icon (•••) and choose Edit. When the Edit Scheduled Report page opens, make changes as necessary and then click Finish to save your changes.
You can trigger scheduled reports at any time. After a report is generated, it downloads automatically and is available on the History tab. To run a report, select Download in the Actions column.
Note that triggering a report manually doesn’t impact its next generation time or the last execution time in the Last Report.
To pause or resume a report, select the actions icon (•••) and select Pause to pause the report or select Resume to reactivate the paused report.
To delete a scheduled report, select the actions icon (•••) and choose Delete.
Next, confirm that you want to delete the report. Note that deleted reports cannot be recovered.
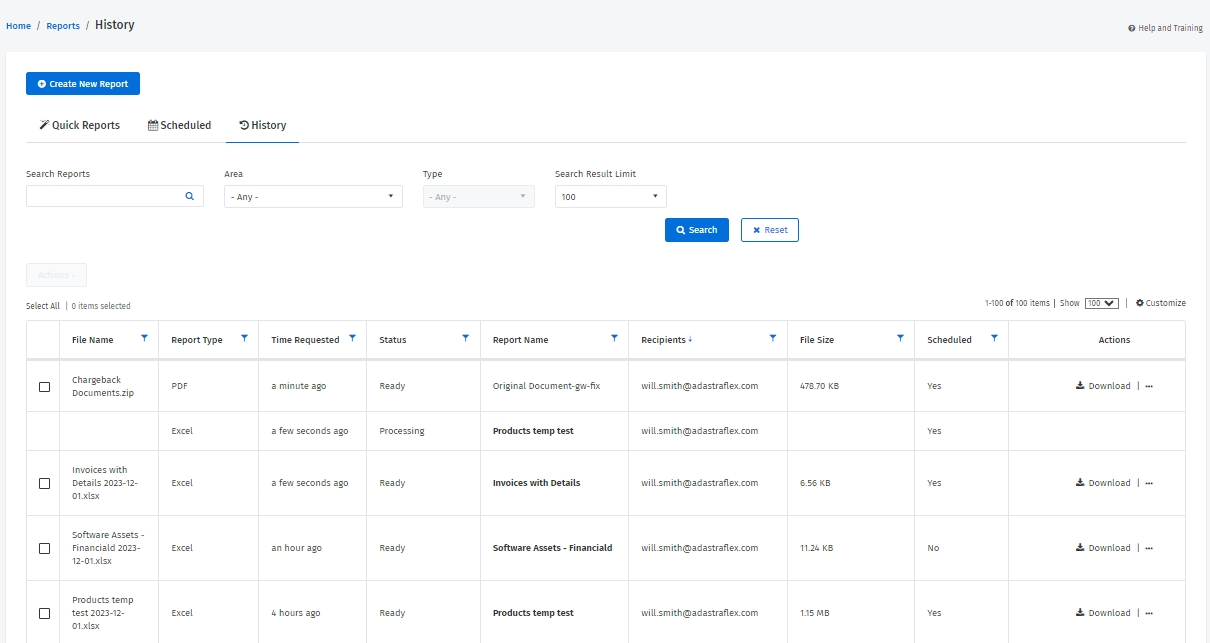
The History tab displays all reports that you've generated. The list includes scheduled and run-once reports. From the Reports History page, you can download, send, delete, or edit a report.
On this tab, you can view the following details:
File Name - The file name of the report (visible only for generated reports).
Report Type - The output format of the report.
Time Requested - The approximate time when the report has been requested.
Status - The status of the report. Possible values include:
Queued - The report is queued for creation.
Processing - The report is being generated.
Ready - The report has been generated and can be downloaded.
Report Ready - SFTP Failed - The report has been generated but there was an issue when sending it to the configured SFTP server. You can manually download the report and send it to an SFTP.
No Data - The generated report contains no data.
Error - There was an unexpected error during the report generation.
Error – Bad Configuration - There was an error in the report configuration.
No permissions - The report couldn’t be generated because the user no longer has permissions.
Report Name - The name of the report.
Recipients - The list of recipients for the Email delivery method only.
File Size - The size of the generated report file (visible only for generated reports).
Scheduled - The information whether it is Scheduled or Run Once report.
Actions - The list of actions for reports.
You can download a single or multiple reports from the History tab.
Follow these steps to download a report:
Locate the report or select the checkbox for the report you wish to download. You can select multiple checkboxes.
Do one of the following:
In the Actions column, click Download.
From the Actions menu above the table, choose Download, Copy to ZIP file, or Move to Zip File. Note that this menu is enabled only after you select a checkbox.
You can only update the name of a generated report and file name. Updating a generated report name doesn't change the scheduled report name based on which the report has been generated.
Follow these steps to update a report or file name:
Select the actions icon (•••) and choose Edit. The edit mode is enabled.
Update the report name and file name as needed. Note that the file name must include an extension, Invoices.xlsx.
Update your changes.
If a report is bigger than 25 MB, it's always sent as a link only. Note that to download a report from the link, your email recipients must have access to the report in the Client Portal.
Follow these steps to send a report through email:
Select the actions icon (•••) and then choose Email.
Provide the email addresses (separated by a semicolon) and choose if you want to send the report as an Attachment or Link.
Send your report.
You can send a report directly to a secure FTP server. If needed, you can also add a new SFTP configuration or edit the existing configuration.
Follow these steps to send a report to an SFTP:
Select the actions icon (•••) and select SFTP.
Select an SFTP server from the list and choose Use Selected Server.
You can delete reports that are no longer needed. You can delete a single report or multiple reports at once. Note that once you delete a report, it can't be recovered.
Follow these steps to delete a report:
Locate the report or select the checkbox for the report you wish to delete.
Do one of the following:
Select the actions icon (•••) and then select Delete.
From the Actions menu, choose Delete. Note that this menu is enabled only after you select a checkbox.
Confirm that you want to delete the report.
You can create a new template when you are creating a report. Note that only some reports support templates.
Follow these steps to create a template:
Click Create New Report. The report wizard starts.
In the Template section, click Saved Templates > Edit Default Columns.
Make the following changes as needed and select Save as new template.
To change a column position, drag the column to the desired position. You can move columns between groups.
To move all columns from one group to another, drag the entire group to an unfolded group.
To override a column’s value, enter a new value in the Override value.
To duplicate or delete a column, select the actions icon ( ••• ) and choose Duplicate or Delete.
Provide the Template Name and choose whether the template is Personal (only you can see or edit it) or Shared (anyone in your company can see or edit it).
Select Save as new template.
You can edit or delete your report template by selecting the template and choosing Edit or Delete.
You can edit all templates, except the default template.
You can only delete templates that are not used in other reports. Additionally, removing a template doesn’t impact already generated reports.
Deleted templates cannot be recovered.
You can export a report of your ServiceNow Assets.
We have created an asset report template specifically for ServiceNow.
You can download the report and upload it directly to your ServiceNow to populate your software assets.
To access the report, navigate to Inventory > Software Assets. When the Software Assets page displays, hover over Exports and choose Service Now.
For information on how to create a report, see Creating reports.
You can export a report of your Aspera license agreements.
The Marketplace Platform contains a license agreement report template specifically for USU.
You can download the report and upload it directly into your USU system to populate your License Agreements.
Follow these steps to access the report:
From the main menu, navigate to Inventory > License Agreements.
On the License Agreements page, hover over Exports and select Contracts - Aspera.
On the Create New Report - Contracts - Aspera page, choose the format, schedule, date range, and delivery method.
Select Run.
You can set up cloud consumption alerts so that you are notified when your cloud spend exceeds certain thresholds.
Consumption alerts are supported for IaaS/PaaS cloud platforms:
Azure
Amazon Web Services (AWS)
Currently, there are three types of cloud consumption alerts - Spike Alerts, Overage Alerts, and Reserved Instance Utilization.
Spike alerting is designed to identify and alert you of usage anomalies in your Azure or AWS environments. You can configure usage thresholds, as well as communication preferences should your consumption exceed your defined threshold.
By default, the Client Portal defines the alert threshold at a 25% spike in consumption compared to the previous month across all subscriptions.
You can also define consumption parameters over a period. The Overage Alert will notify you if the value is exceeded.
Overage alerting gives very granular control, allowing you to set the consumption value as well as a period against which the service is monitoring consumption.
Reserved Instance alerting allows you to set minimum utilization thresholds that monitor the consumption of your reservation purchase.
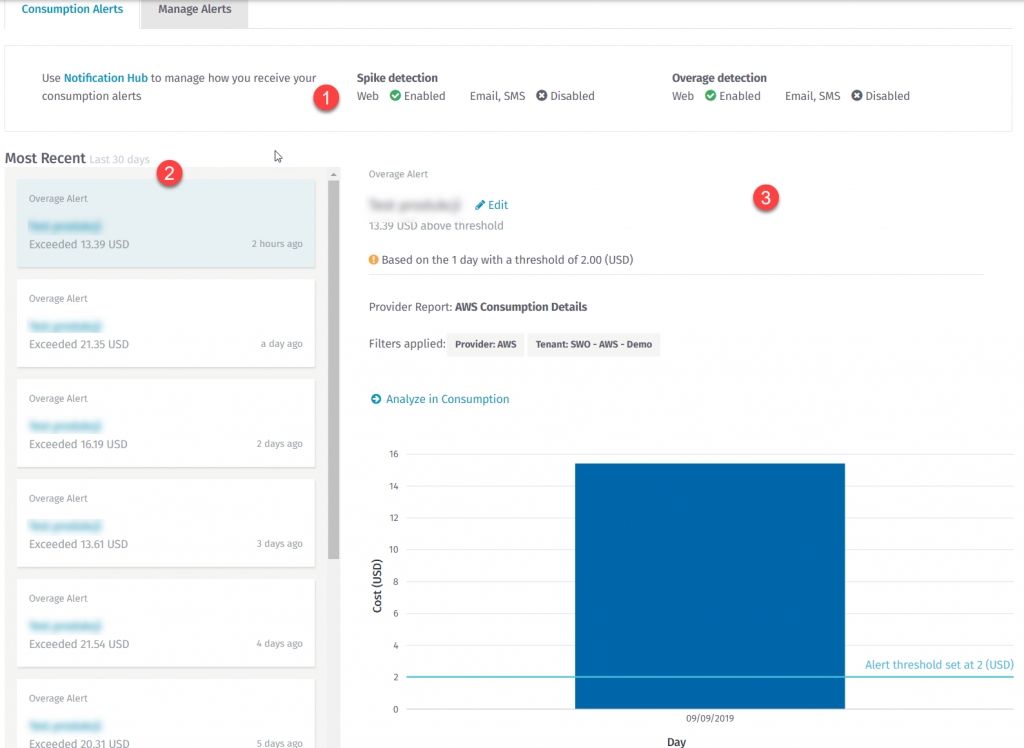
The top section (1) describes Notification Hub settings. In the example above, you can see that this user only has Web notification enabled for both Spike and Overage alert types.
The left Pane (2) is a list of all alerts for the past 30 days and the right pane (3) shows details about the currently selected alert.
You can access consumption alerts from any cloud consumption reports. You see the alert list by default. This report provides a basic overview of generated consumption alerts for every Cloud Provider that you configured.
Essentially two modules are available in consumption alerts:
Consumption Alerts
Manage Alert
This tab contains information about all generated alerts.
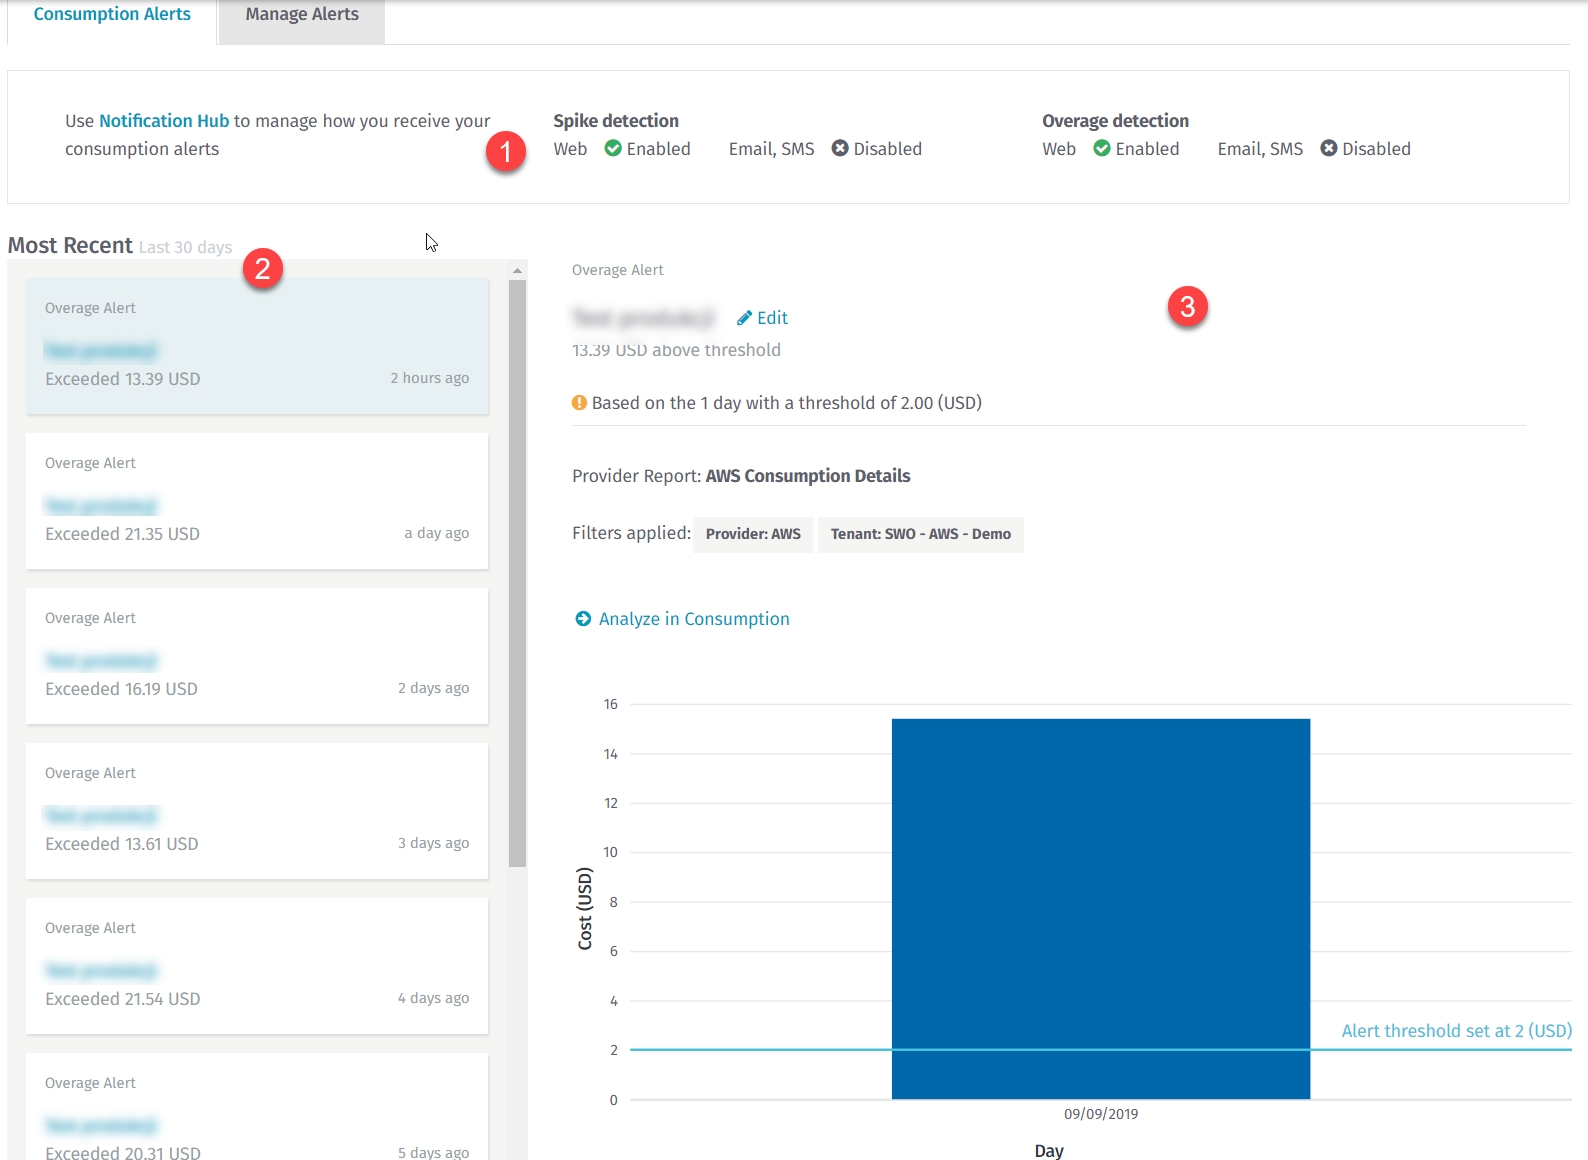
The top section (1) describes Notification Hub settings. In the example above, you can see that this user only has Web notification enabled for both Spike and Overage alert types.
The left Pane (2) is a list of all alerts for the past 30 days and the right pane (3) shows details about the currently selected alert.
This tab allows you to manage your alert definitions and notifications.
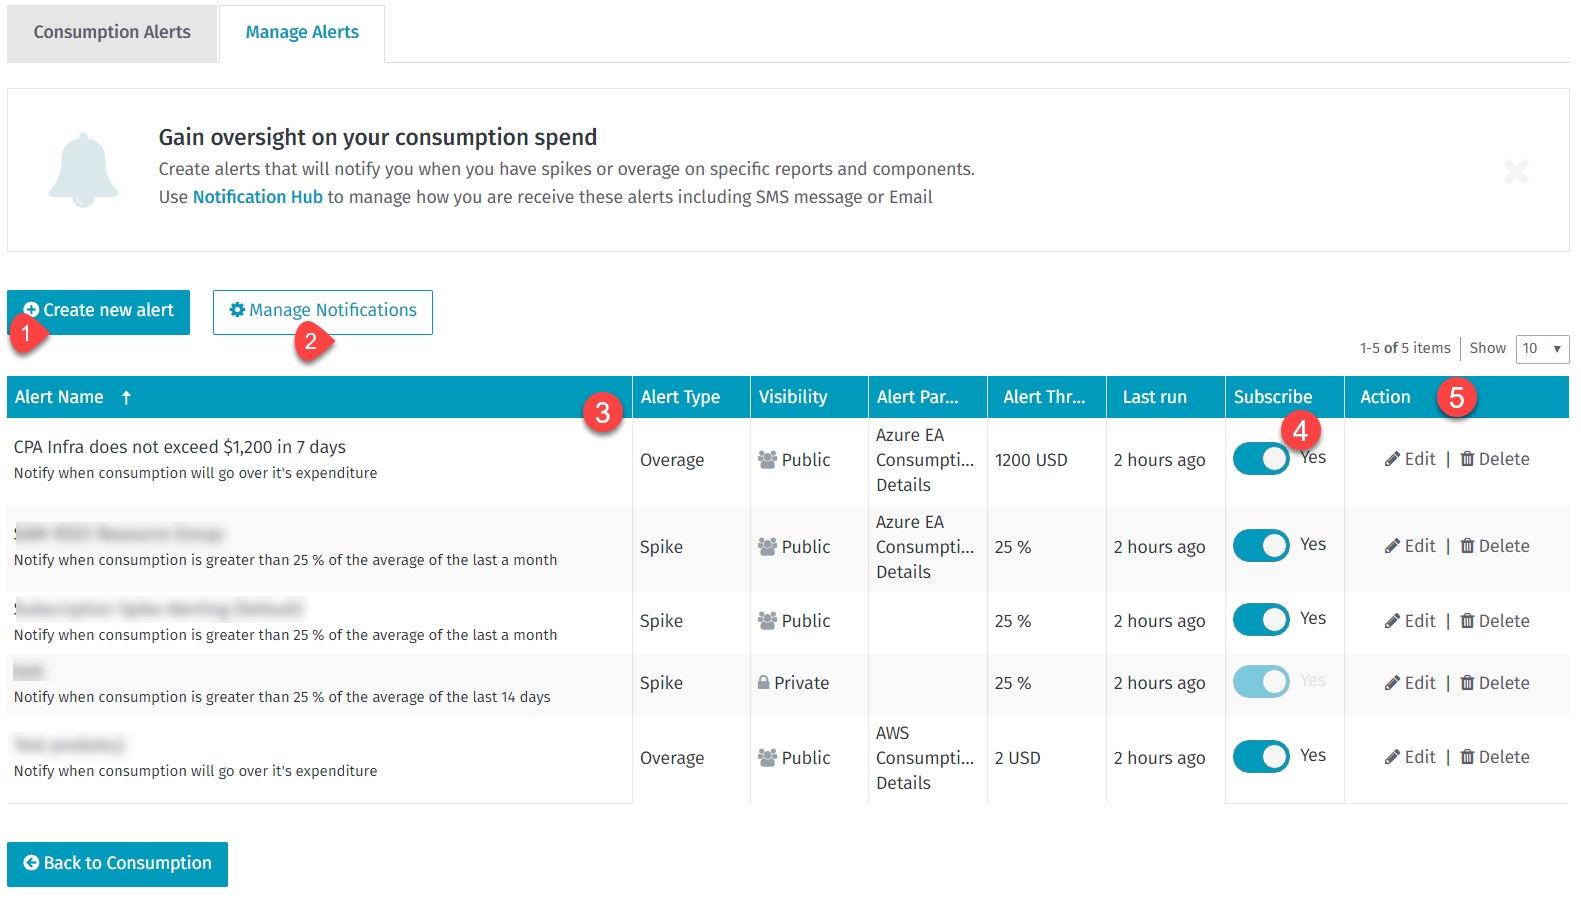
Create new alert (1) opens a new interactive form where you can precisely configure your alert definition.
Manage Notification (2), brings you to the Notification Hub configuration page, where you can precisely configure in which form you wish to see notifications.
In the Alerts section (3) you can see a list of all created alerts, along with the most important columns to quickly grasp the context of the definition.
Subscribe column (4) has a toggle button where you can subscribe/unsubscribe from particular definitions. If you are not subscribed, you will not receive any notification from that alert in any form.
Quick actions (5) can be used to quickly modify or remove alert definitions.
The Consumption Alerts tab presents all created alerts. Alerts are evaluated once a day at 23:00 (Universal time zone)
New execution entries have a “New” badge and by default, you can view entries from the last 30 days. By clicking on an entry, you are marking it as read thus the “New” badge will be removed.
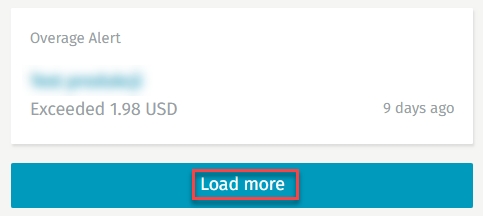
the To load more alerts, click “Load more” button when you reach the bottom of the execution list.
The details section is loaded immediately after clicking on the alert from the left pane.
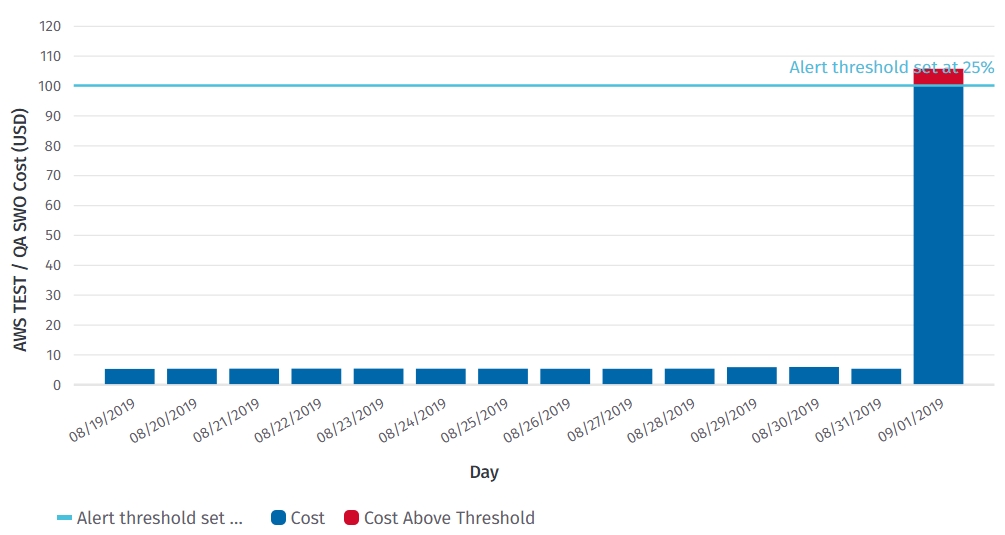
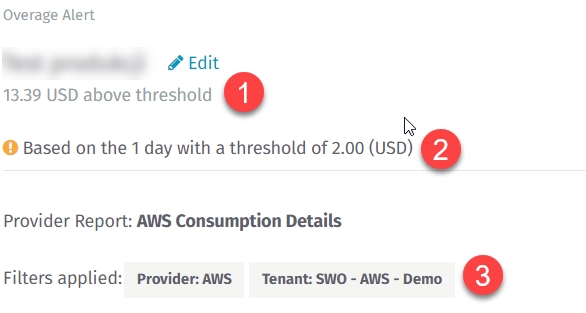
The top section (1) shows a brief explanation of why the alert was created, for example: 13.39 USD above the set threshold.
You can also see details loaded directly from the alerts definition (2), like threshold, time range, and applied filters.
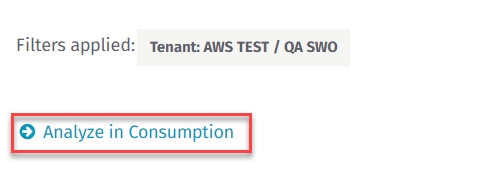
The bottom section (3) shows the Filters that have been applied.
The preview section is a graphical representation of the alert and highlights the point of time when it occurs.
You can interact with this chart similarly to the Consumption Reports, which includes “hover-over text” when you are viewing a vertical bar in the chart.
The Alert item allows you to perform more detailed analysis in Consumption Reports so you can find the root cause of that alert. When you follow the “Analyze Consumption” link, the report will be opened in a new tab with the filters and dates extracted from the alert.
Notification configuration allows you to set your preferred delivery methods for the alerts you have configured. The configuration page can be accessed by clicking on the “Notification Hub” link or “bell” icon in the top menu bar.
Once the Notification Hub page appears, a section for consumption settings is displayed. This is where you can individually configure delivery methods for Spike and Overage alert types.
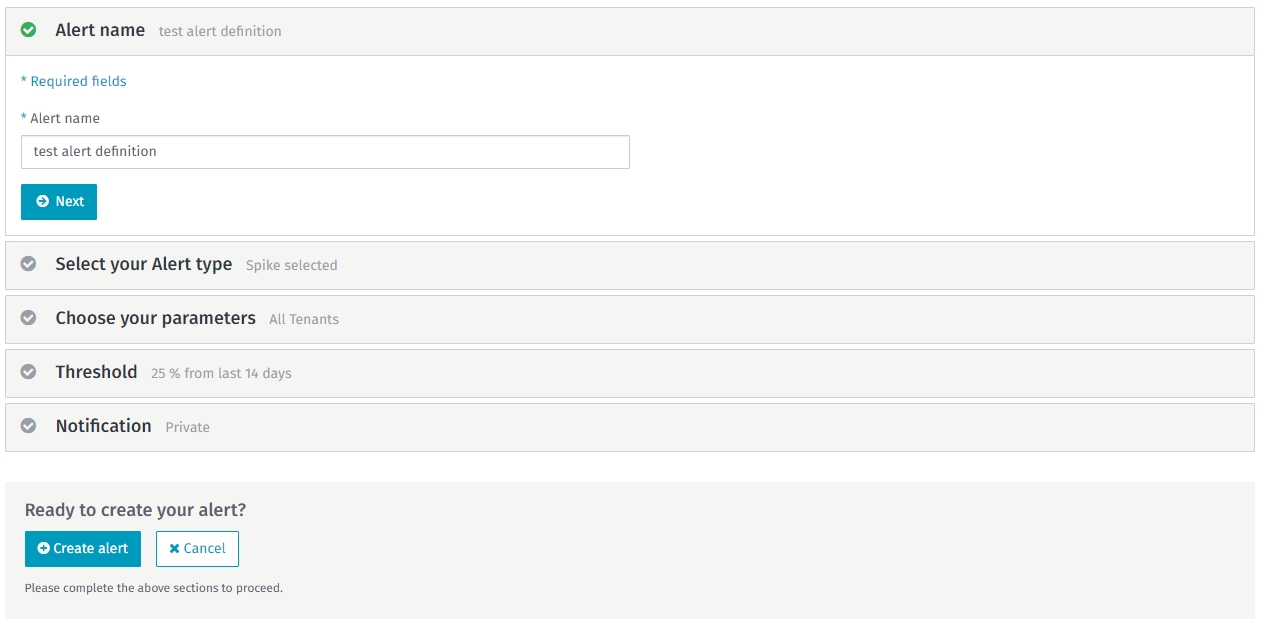
You can access the wizard by clicking Create New Alert or Edit. Remember that the alert name has to be unique across all of your alerts.
Notification alerting supports the following two modes:
Spike mode is used to detect anomalies in your consumption characteristics, for instance, a Virtual Machine that was left running after performance tests executed by the team.
Overage mode is used to track if the overall consumption is in the defined boundary (threshold).
Parameters allow you to control the behavior and data scope of the alert. By choosing All Tenants or All Subscriptions each tenant or subscription will be monitored separately.
For example, you configured the threshold as follows:
14 days, and
Spend increase of 25%
This means that the above rule will be applied individually to all subscriptions or tenants. If the condition is met, a notification will be produced.
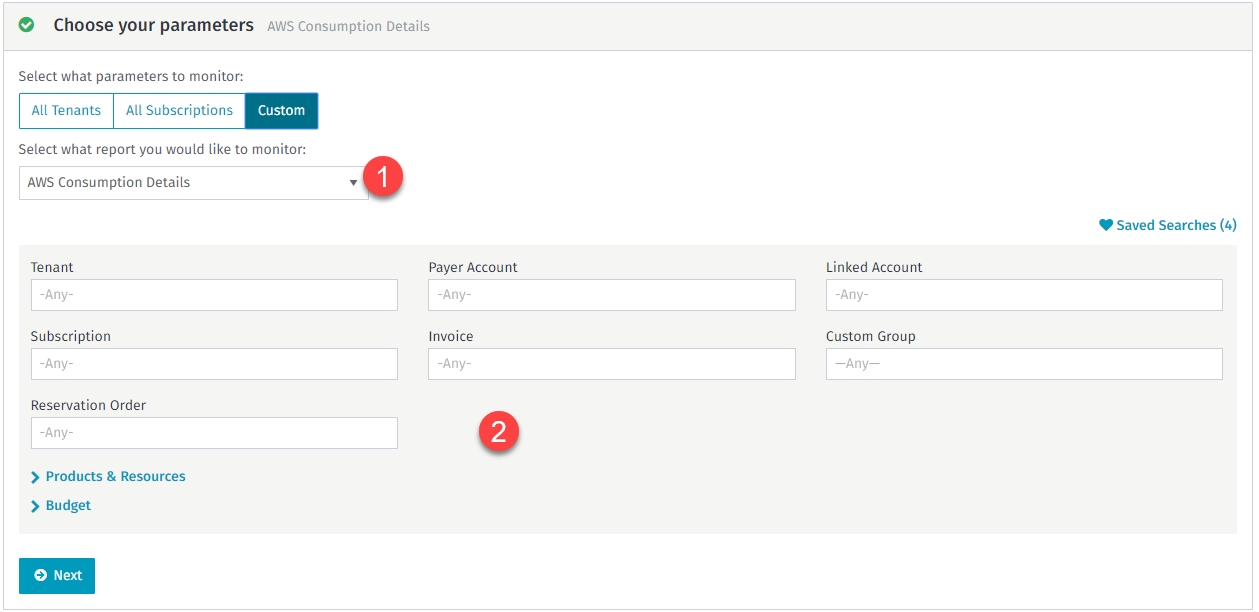
The Custom option works slightly differently. First, you need to select a report type (1) and then you can precisely craft your definition, using that report (2).
For instance, you may only want to monitor virtual machines in a single subscription. To do that in the report selector (1) you should select Azure EA Consumption Details, then select Virtual Machine in the Meter Category, and then narrow down the subscription filter according to your requirements.
If you are actively using the Save Filters functionality, you can click Save Search and all saved filter combinations will be available.
In this section, you are configuring the criteria of the alert. First, you select the time context in which the average or sum cost will be calculated from (1). Then you should decide on the % or cost threshold to monitor (2).
For example, on a Spike Alert, by selecting 14 days, the average from the last two weeks will be calculated. Let’s assume the result is 100 USD. You now set your threshold to 25%. Your consumption will be monitored and any spend that is greater than 125 USD will be reported as notification.
Additionally, you can control two extra parameters (3):
Ignore days with no spend: If enabled, it means that days with no consumption will not be counted within the average. For example, disabling Virtual Machines during the weekends.
Minimum alert value: This means that you will be notified only when criteria (1) are met and the spending is greater than the provided value. This is helpful when monitoring spend under a specific value and a spike in these scenarios may be too noisy. For example, you may have a daily spend of $5, so a spike to $10 may not be as relevant until that spike exceeds a certain amount (like $100).
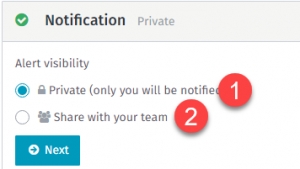
Alert definitions can be private. A private alert means that it will only be visible to you (1). A public alert means that you can share this alert configuration with anyone in your company (2).
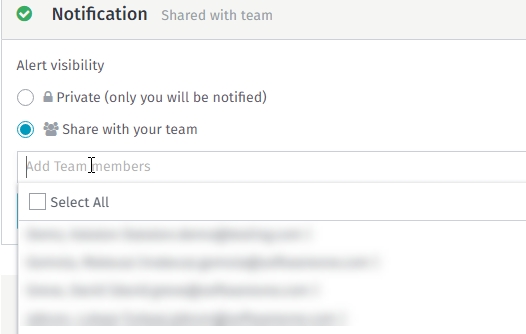
When you select share with your team, an additional dropdown appears where you can add team members individually. By default people with whom the alert is shared are unsubscribed – they have to subscribe to the alert to see notifications, this prevents you from generating unwanted notifications on other user’s accounts.
Get insights into competitors share of cloud services with our Cloud Journey Reports.
SoftwareOne is uniquely positioned to help businesses on their cloud journey, and with our xSimple customers in mind, we have built a complementary report for our “Simple” views.
We currently only support AzureSimple service.
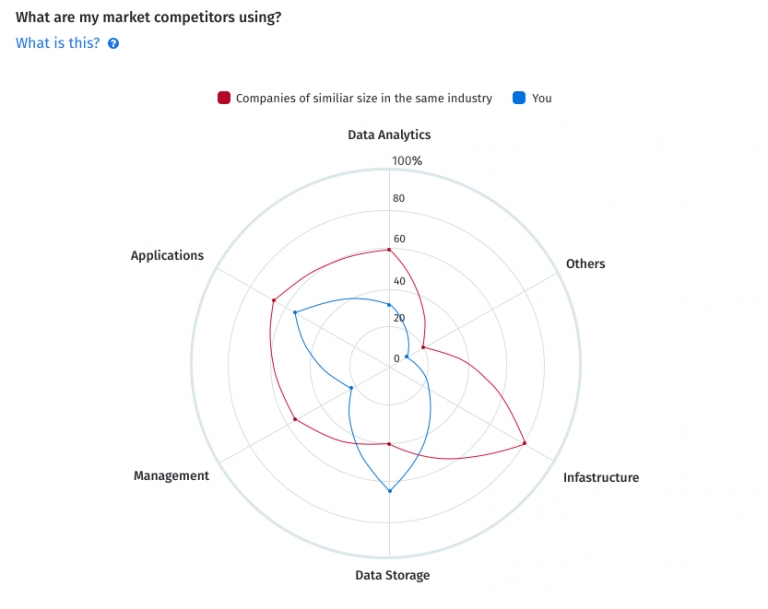
The Cloud Journey Report gives our Simple customers a unique insight into market competitors' share of cloud services, which paints a picture of their own position compared to those competitors. By analyzing this information, you can take full advantage of improving your operations, maximizing cloud features, and optimizing your cloud cost. Market Competitors are companies of a similar size and from the same industry.
The Cloud Journey Report is divided into 4 sections:
Comparison Panel
Information Panel
Managed Service Panel
Service Articles Panel
This is the backbone of the Cloud Journey Report, where you can easily see your position in cloud service usage compared to their market competitors.
A radar chart outlines service use across cloud service categories, and any gaps are easily identified.
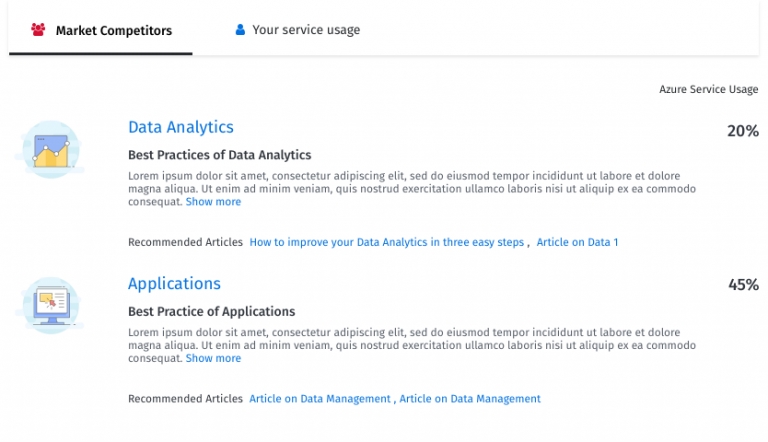
For a better understanding of your market competitor's share across categories, and why they may utilize given services, you can find a list of every category with its share.
You will also find relevant articles that describe the benefits of using those respective services, just under the radar chart.
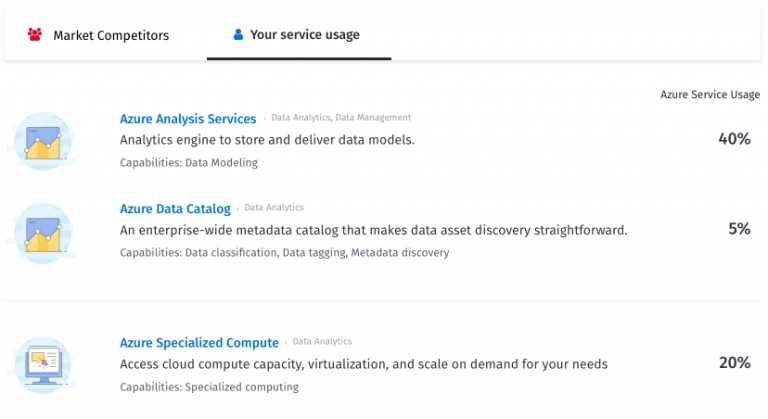
On the Your service usage tab, you can refer to a complete list of their services for comparison.
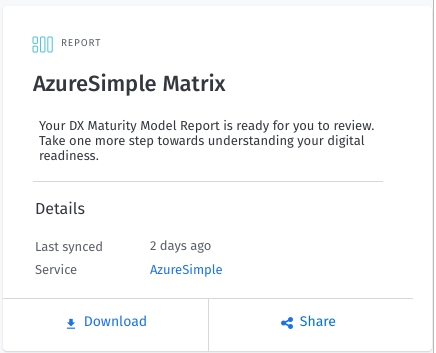
As the name suggests, this panel gives you a brief description of your currently used SoftwareONE service. It also shows when it was last updated and you can download the report in PDF format.
For AzureSimple service data is collected once a month.
There is so much to learn and adapt in the cloud, but many organizations don’t have the time or expertise to achieve optimal results. Consequently, this leads to missing:
Optimal security configurations
Cost optimization opportunities
Understanding of governance strategies
Opportunities to innovate with cloud
Cloud-focused and automated operational outcomes
Optimal migration strategies and full use of the cloud
Understanding of cloud scope against current consumption
Whether a business is using some or many cloud resources, not having a proper strategy will lead to a lack of operational standards, security risks, and wasted cloud costs.
For that reason, we offer our customers an easy way to opt in for Managed Service.
This panel is another good source of relevant articles that can help you on your cloud journey.
Create multiple custom report views and combine them into one simple dashboard experience.
With the new reporting capability, you can create multiple custom views and aggregate them into a simple dashboard experience.
Follow these steps to create a custom executive report:
From the main menu, navigate to Cloud tools > Consumption Overview.
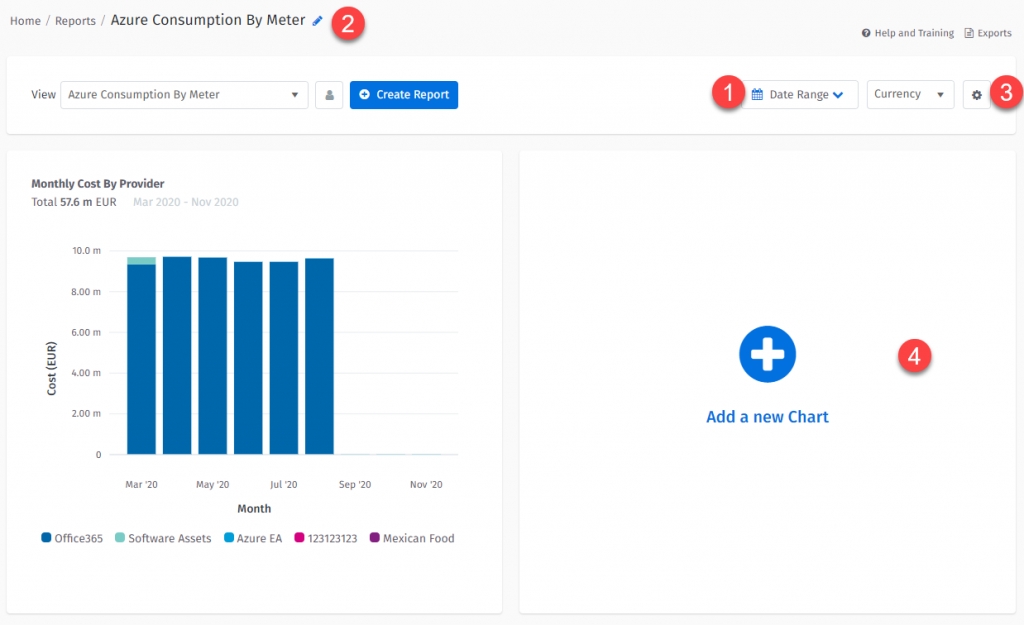
Select Executive Report and then select Add your Report to create your custom report.
Enter a name for your new report. The name can be changed later if needed.
The report with aggregated Provider data will be added to your new Executive Report.
You will also see spaces with a “plus icon” (4). Clicking on the plus icon allows you to quickly add new data that is of interest to you.
Each element has its own filters and grouping – including date range. You can override dates, grouping, and currency in the report context to align all elements.
Dates, grouping, or currency overrides are not saved. So when you open the report again it will present data in the default state.
Only elements that are time-based will be affected by grouping changes. Elements with a custom “X” axis will ignore this setting.
You can delete a report by selecting the cog icon (3) and selecting Delete report. Once you confirm this action the report will disappear from the drop-down.
Similarly, you can edit the report name by clicking on the pencil icon. All changes made in the report are auto-saved.
Follow these steps to rearrange the elements:
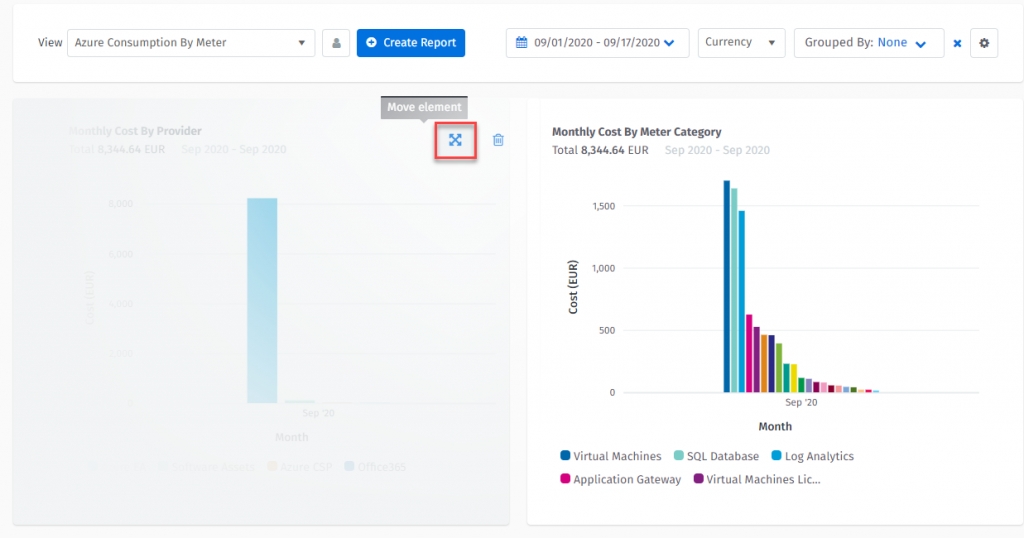
Hover over the element you want to move until you see the cross/arrow icon appear.
Click on that icon and drag the element to the area you want to move it to.
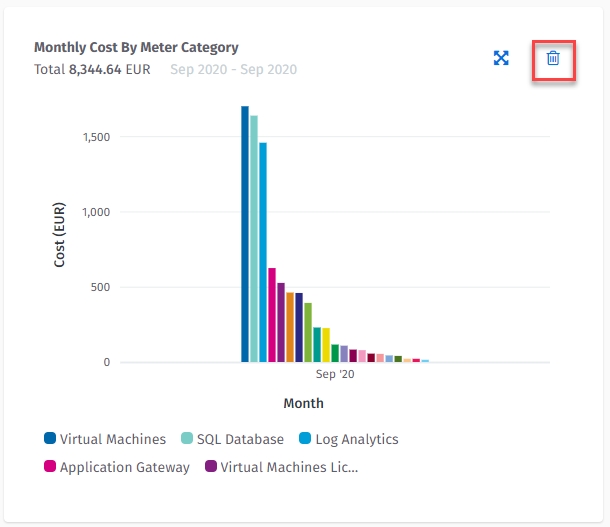
You can remove elements by hovering over the element until you see the bin icon appear. Select the bin to delete the element.
To enter the edit mode, click anywhere on the chart element.
In the configuration section, you can define your data and pick your preferred presentation option.
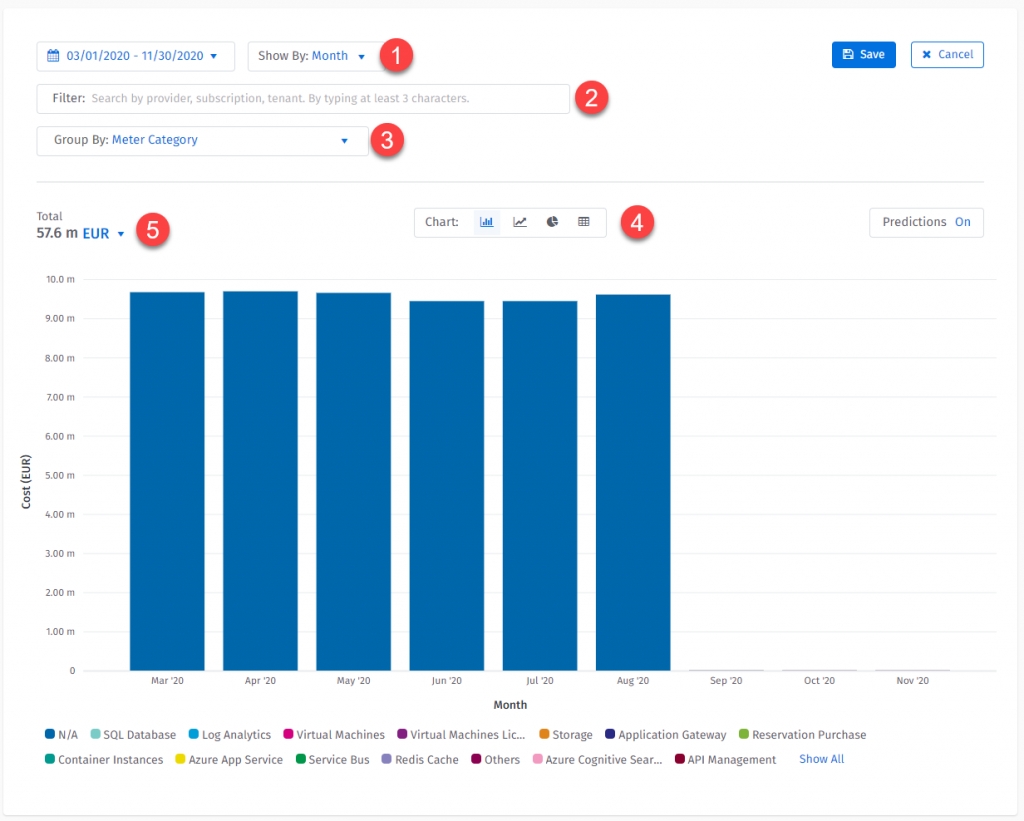
You can control data displayed on the “X” axis in the “Show By:” drop-down (1). Available options are Day, Month, and None.
The Day and Month settings will make the “X” axis time-based. However, None will render the value selected in the “Group by” section (3).
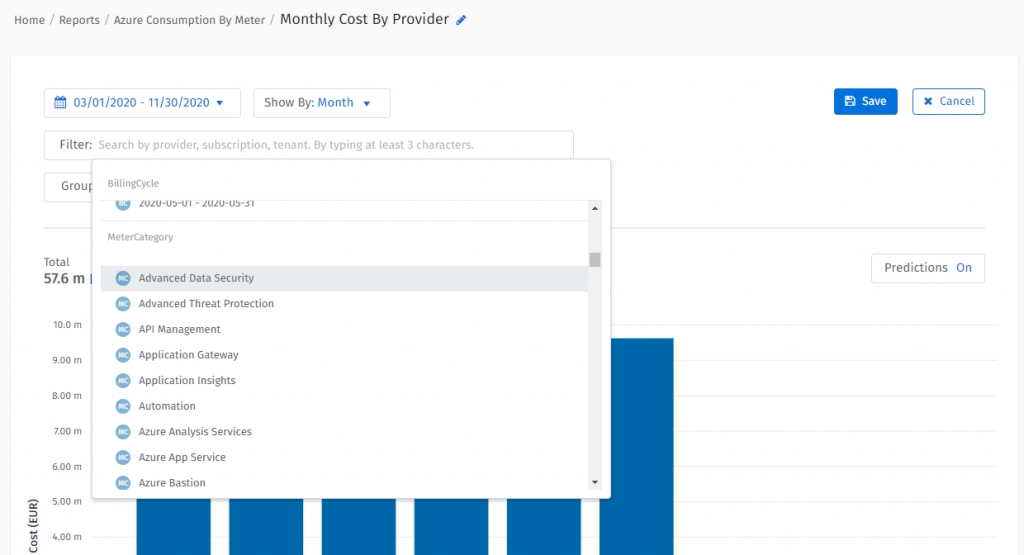
Reports support advanced filtering (2). This scans through all your data providers (e.g. Azure / Software Assets / Virtual) and provides you with a unified search experience.
Search index breaks words by space or “-” character and uses “starts with operator” for each word. For example: for resource my-test-vmineurope if you type “test”, the index will find this resource. However, if you type “est” this resource will not be found.
By clicking the hierarchy icon (4) you can refine your custom group search using the tree structure. The changes made in the custom group selector are reflected in the filter control and vice-versa.
Grouping Selector
There are many grouping options. Availability depends on the providers you have activated (3).
Chart Type Selector
Depending on your business use case you can choose different presentation layers for your data (4), available options are:
Line (perfect for daily time series)
Bars (ideal for categories, for example, MeterCategory)
Pie (the best for summaries, for example, Providers)
Table (in all listings, for example, Resources)
Currency Selector
Each element can have a different currency. By default your budget currency is selected. However, you can change it at any time (5)
Executive Reports support quick share functionality. You can easily share your report with your colleagues by following the steps below.
To share a personal report, select the report you would like to share from the report selection, and click Share.
Next, select members from your account. Allowed roles are Can view and Can edit. Users with the Can Edit role can also adjust the sharing list with limitations to the Owner role.
You can export an executive reports to a PDF. To export a report, select your report from the report selector and select Exports.
You can use the Client Portal to get a comprehensive consumption overview of your cloud usage and cost.
The Consumption Overview feature is a set of functionalities that enable detailed spend analysis. The information is based on billing data fetched daily from a variety of providers, such as Azure, Amazon Web Services (AWS), Office 365, and Software Assets.
The consolidation allows you to analyze spend across multiple platforms in a single view. You can also:
Access multiple analytic reports and browse consumption cost information in easy-to-use interactive charts. The analysis is extended by leveraging information from other modules.
Analyze spend per the Custom Groups or Budgets.
To access Consumption Overview, navigate to Cloud tools > Consumption Overview. The Consolidated Consumption page opens.
A report can consist of multiple pages. A single page can contain multiple charts or tables that provide report data. The data depends on the filters set in the date filter and filter section.
You can use the drill-down functionality to see more granular data on the selected cost. As an example, you can see the cost per day when you drill down on a specific month.
You can use the Filter by functionality to set the selected data item as a report filter. You will then only see this information in the rest of the report charts.
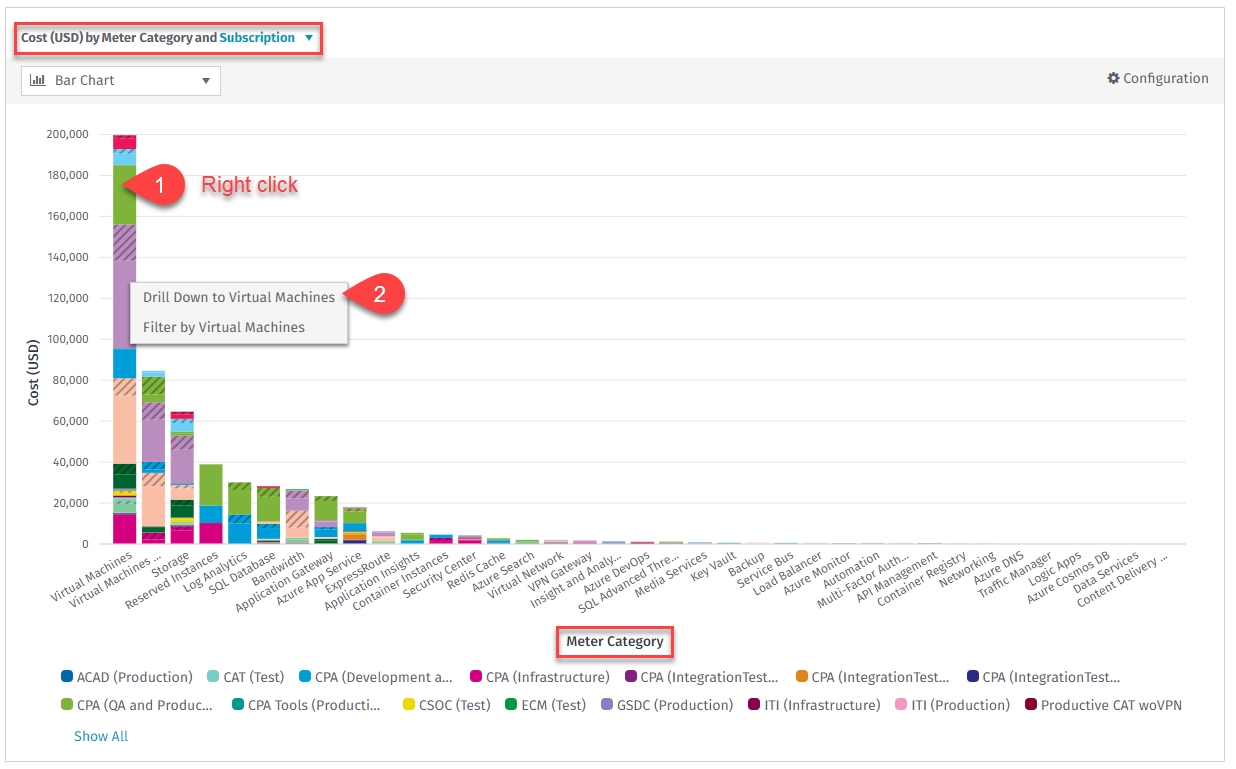
The drill-down option allows very precise data analysis. Most of the reports available in Consumption Overview have been built with a set of hierarchical dimensions that allow you to perform the drill-down action by clicking on an area in the chart.
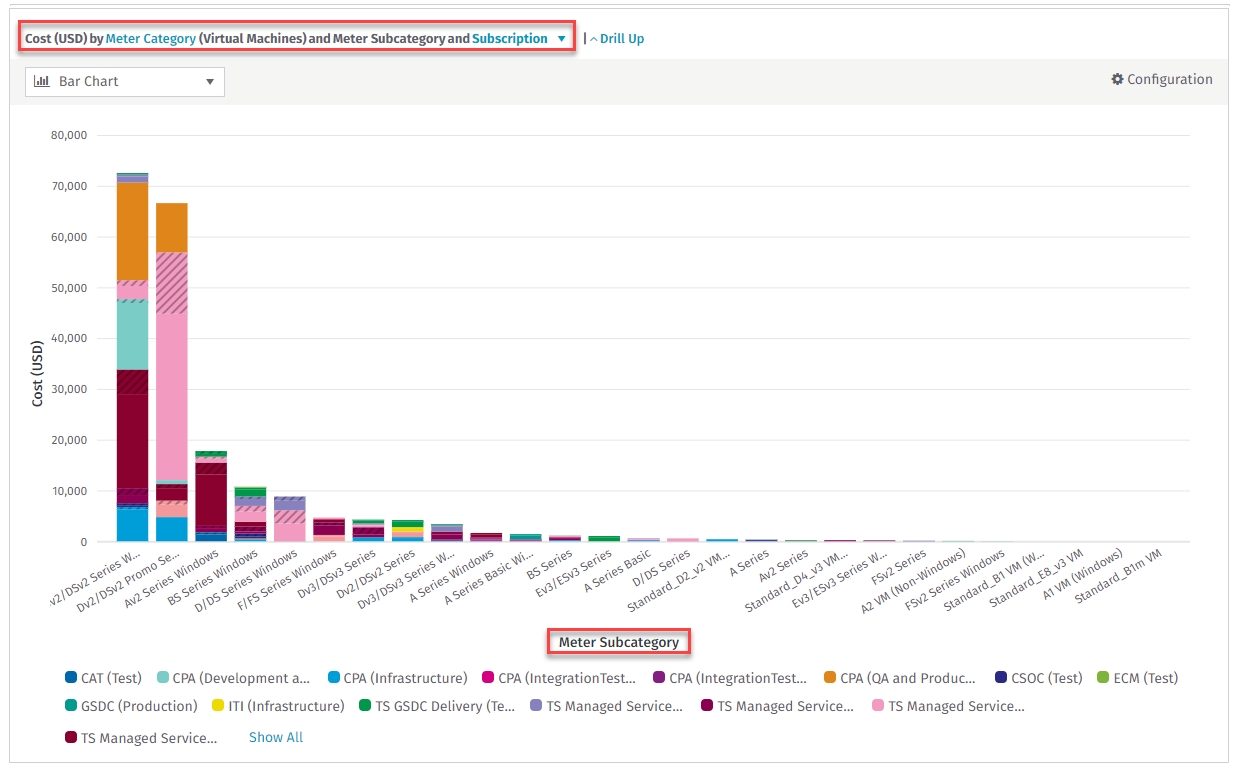
The below screenshots show a drill-down scenario.
Choose a meter category, right-click on its data bar, and select the drill-down option from the context menu.
As a result, the cost chart of the meter subcategories, which are subcategories that exist under the selected meter category will be displayed. The sum of the cost of the meter subcategories is equal to the selected meter category cost. You can continue drilling down if there is another lower-level dimension provided for that chart (meter name in that case).
Please note the current view and horizontal axis descriptions. These help identify the hierarchy level that you are currently on.
Use the drill-up option to go back to the upper level of the hierarchy. The drill-down functionality provides more details of the consumption cost. Such analysis is especially helpful when searching for potential consumption anomalies.
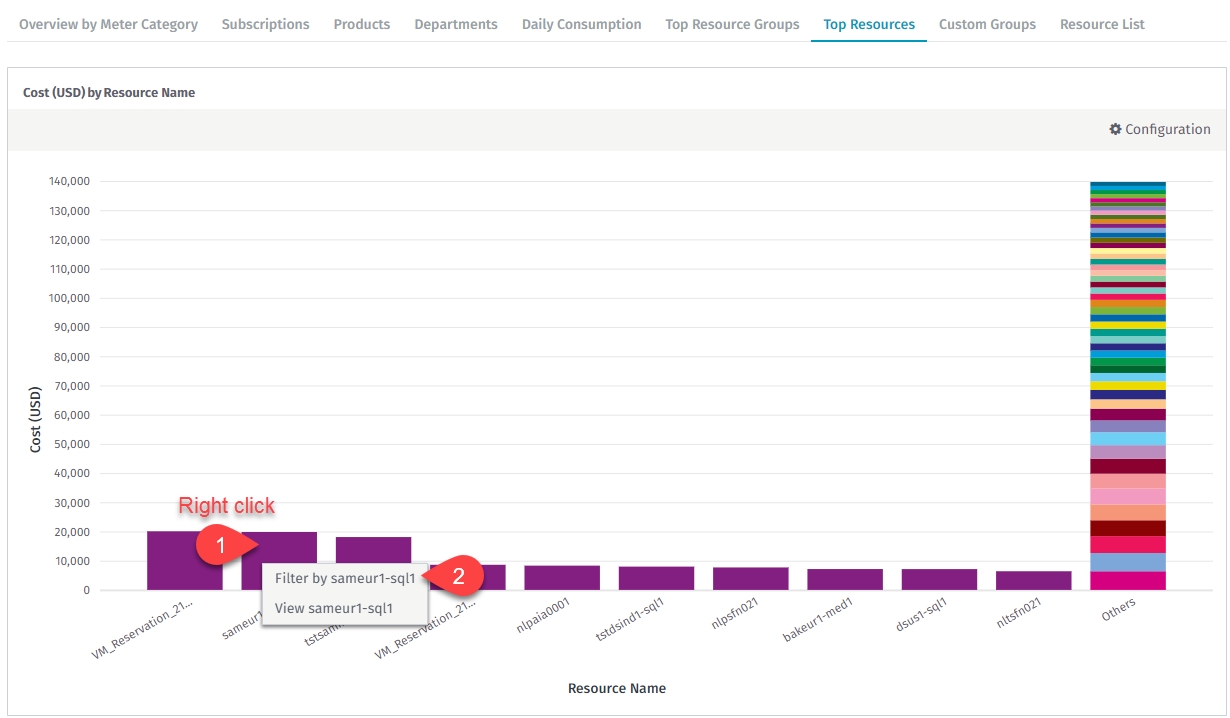
In some cases, you might need to narrow the data context to a single data item (meter category, subscription, resource, etc.). Instead of setting an item as a filter, users can use the Filter by…option. This option works similarly to the drill-down option.
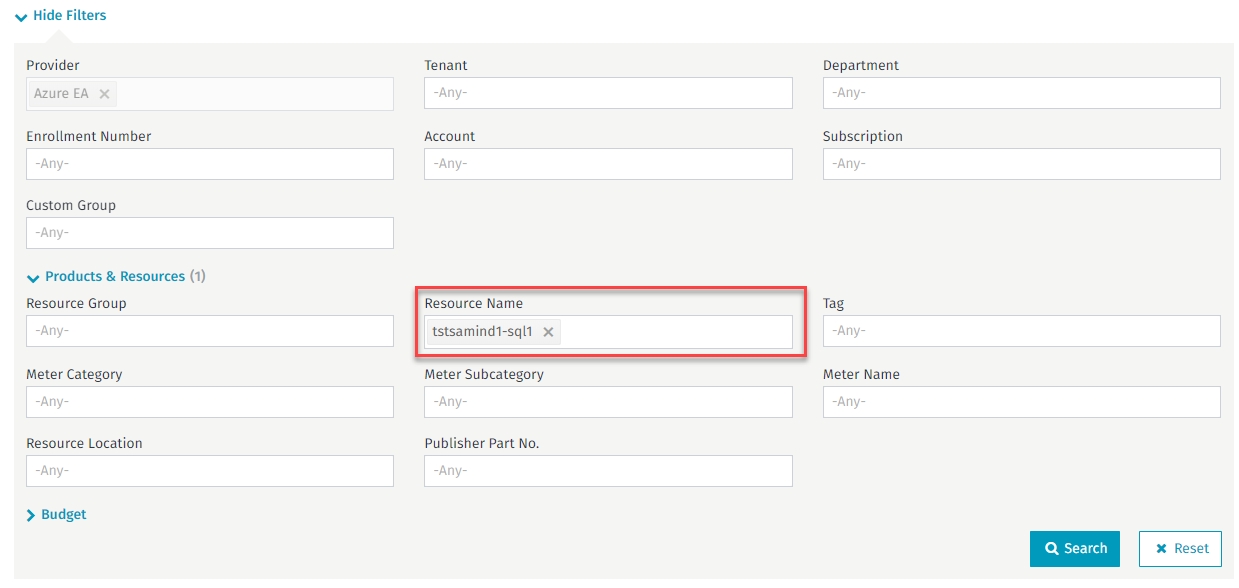
This action will set the selected resource as a filter.
Now the entire report has data scoped to this single resource. You can use any page of the report to analyze its consumption.
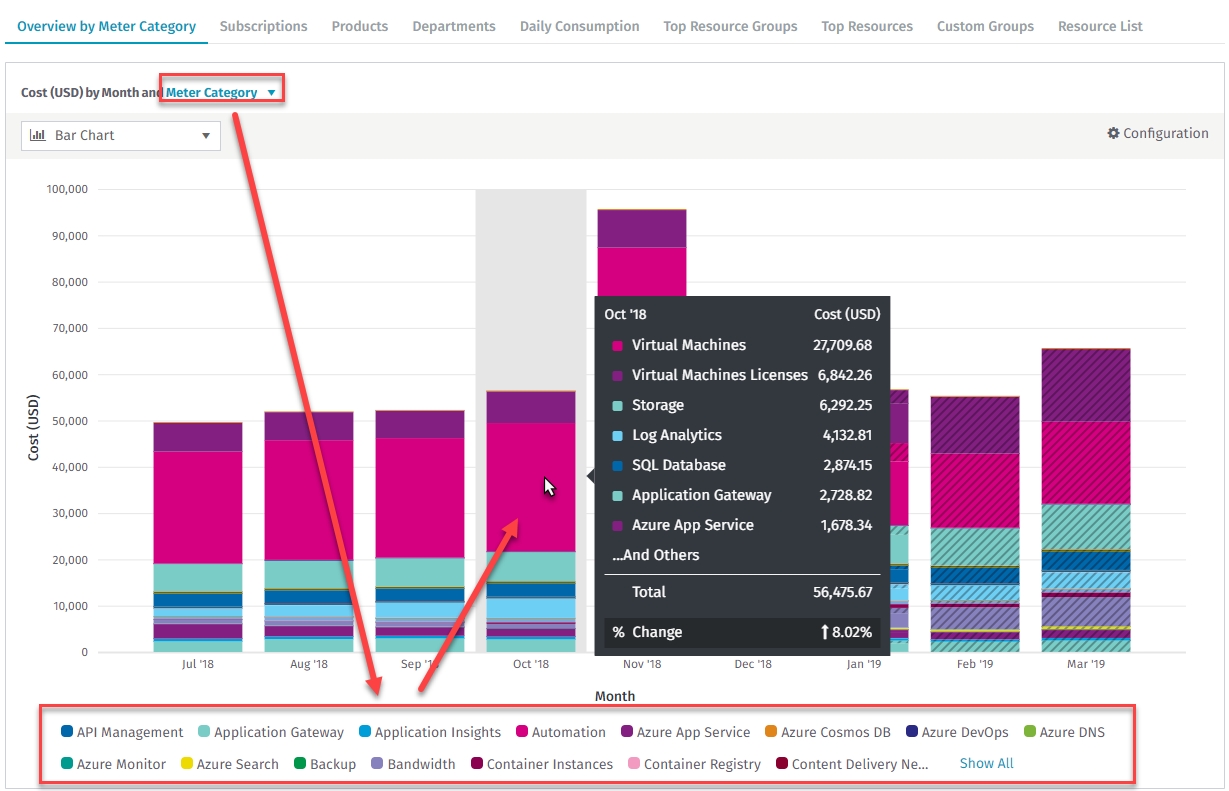
Selected report charts have the ability to slice data with the configured legend. The legend is an additional dimension added to data that slices the consumption values, for example, monthly consumption).
The following is an example of monthly consumption sliced with the meter category legend dimension.
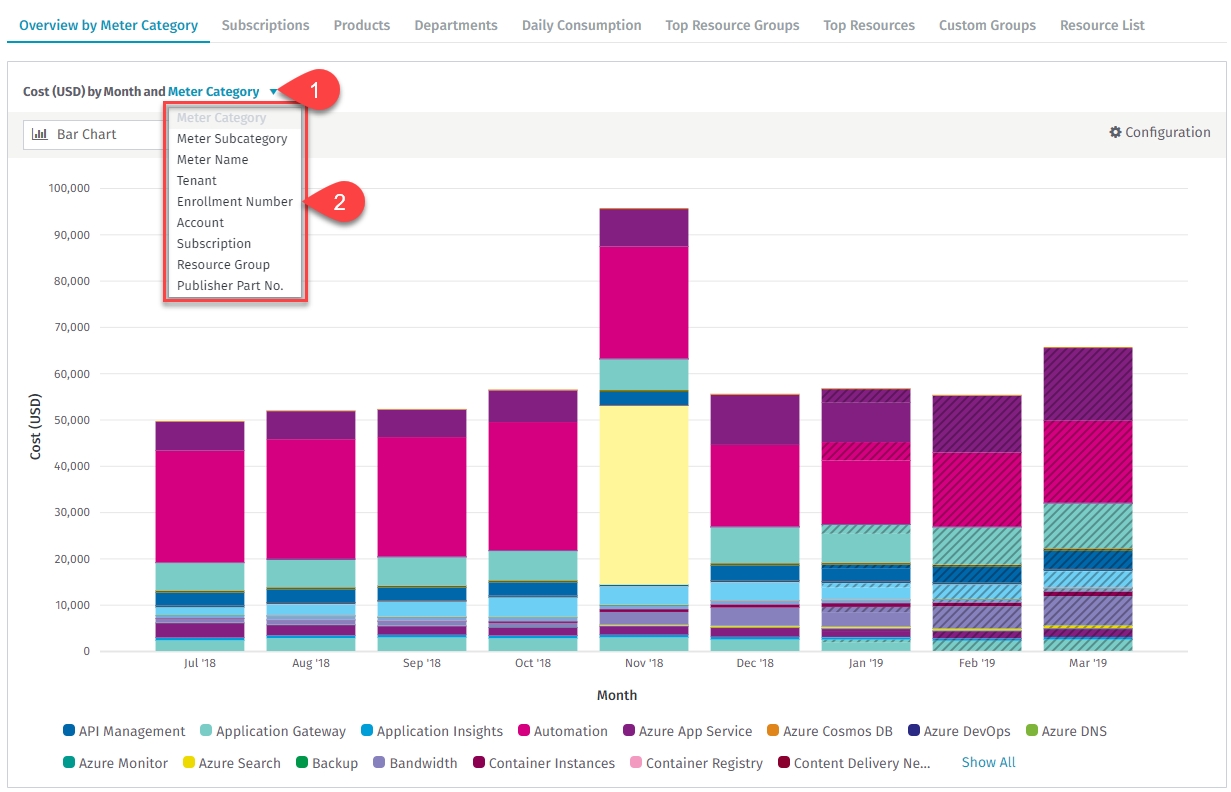
You can change the legend dimension by choosing the legend picker (1) and selecting another dimension (2).
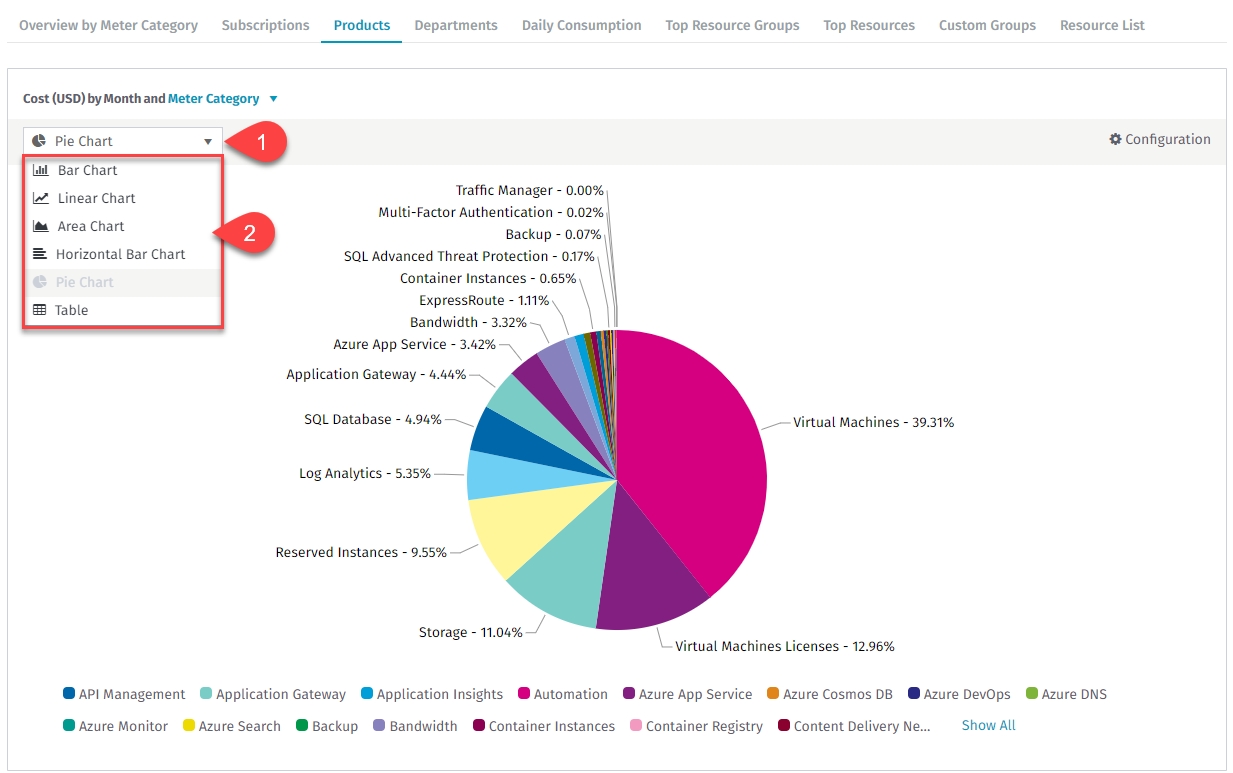
You can switch to different chart types or display data as a table to suit your preference.The following data visualization types are available:
Vertical bar chart
Linear chart
Area chart
Horizontal bar chart
Pie chart
Table
To change the visualization type, select the dropdown (1) and select the visualization type (2).
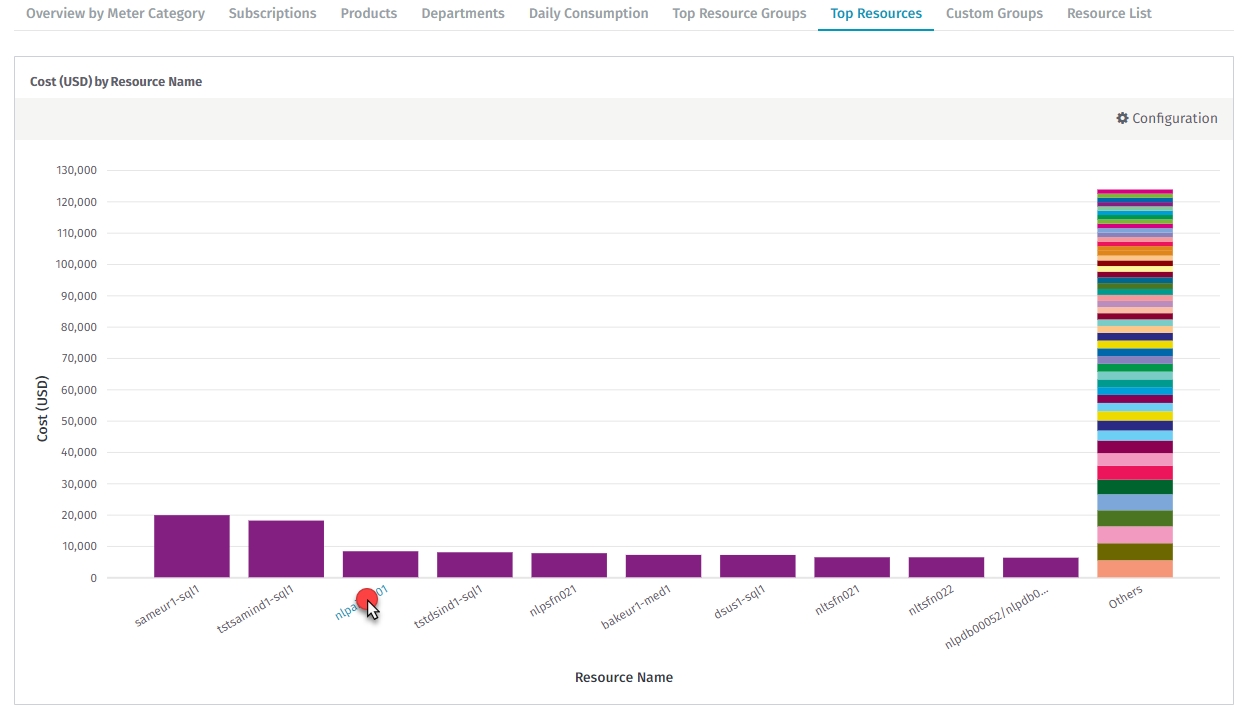
If a chart provides resource data, you can navigate to resource details which are available in Resources. When a chart or a table is displayed, you can select the resource name.
Such navigation is also available when displaying a table.
The selected resource details are displayed in a new Resources window.
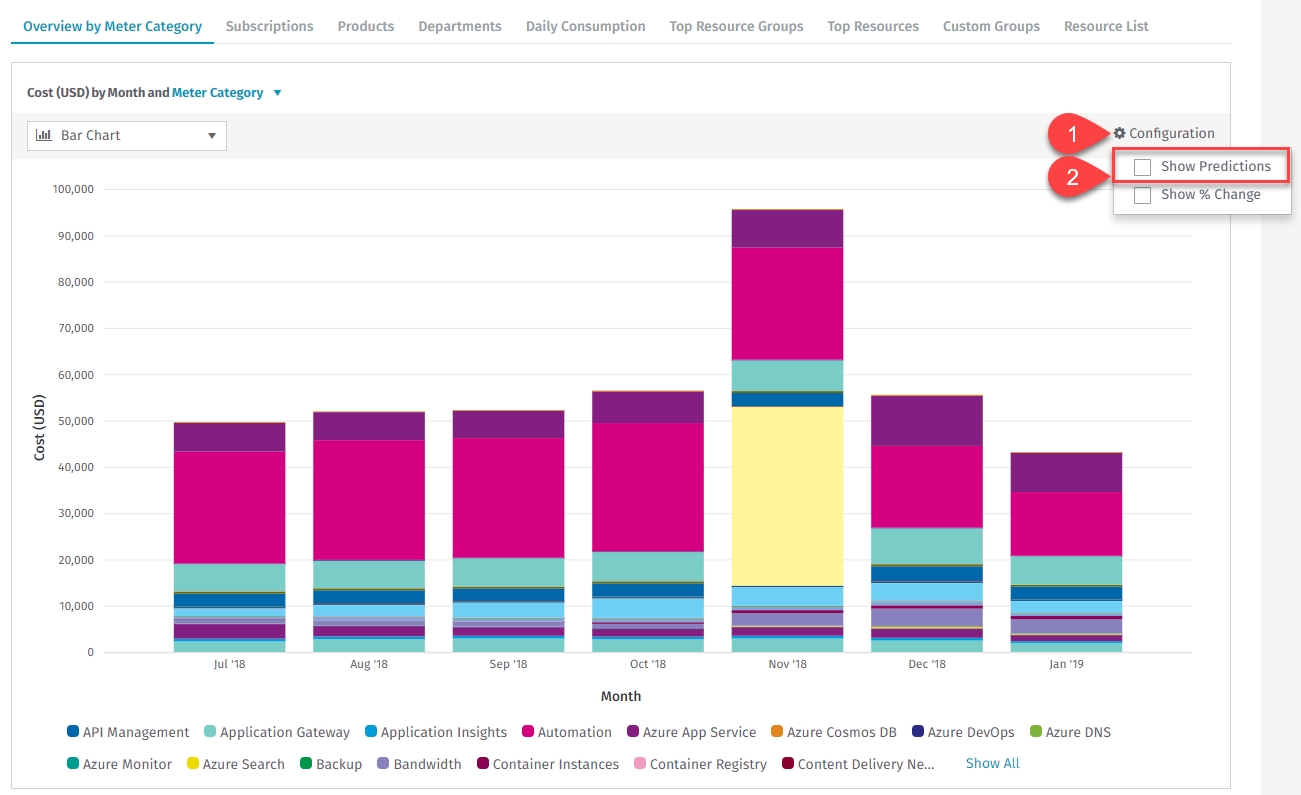
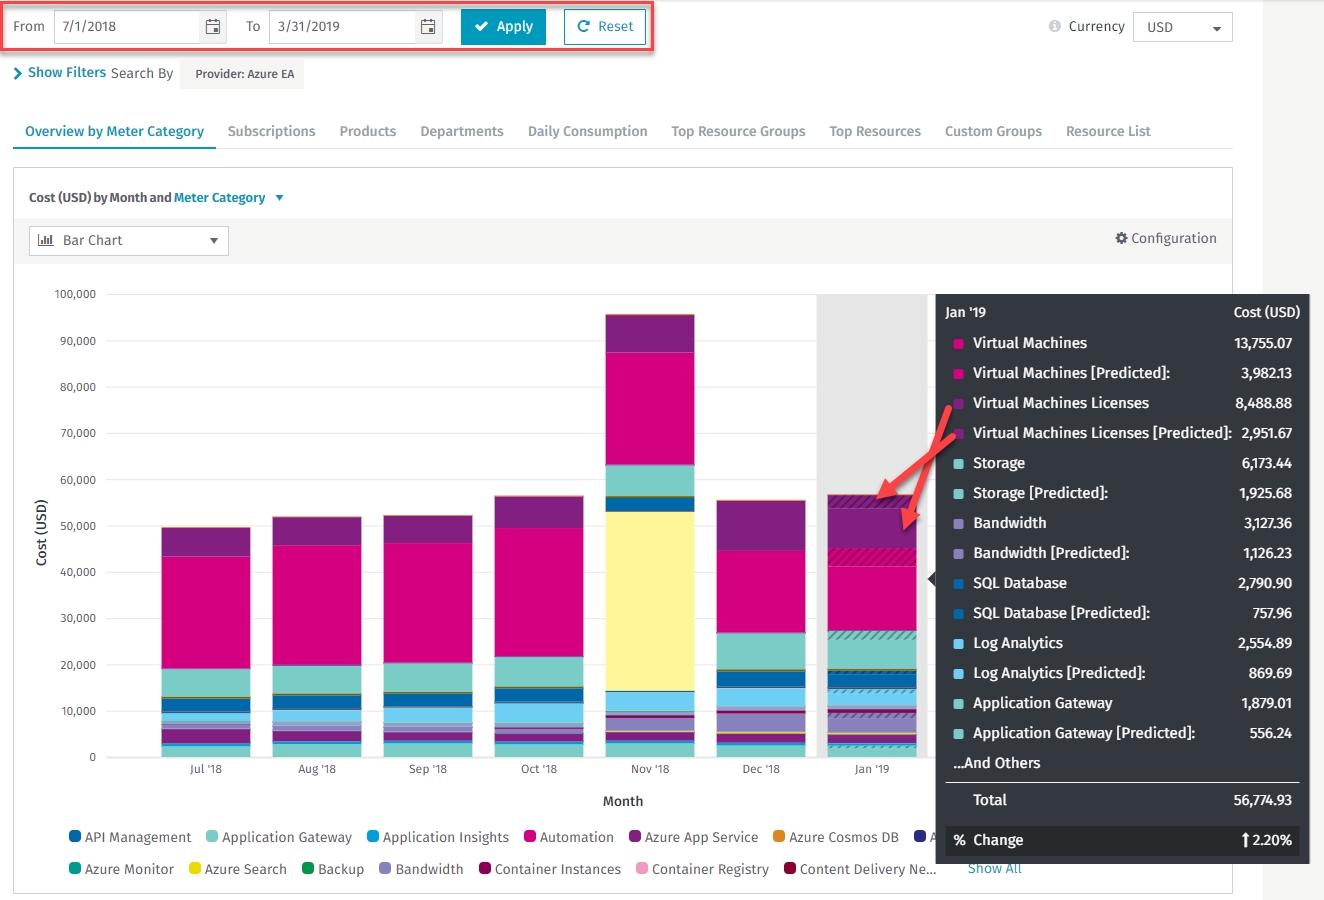
Most of the report charts provide actual and predicted values. Predictions are calculated based on the most recent actual values. Users will see predicted values for the data corresponding to the future time scope, with reference to the current date (if the scope of the time set in the date filter includes future days).
Below is an example of a chart that includes predicted values.
Predictions can be disabled for a chart. Use the configuration option shown below. If the Show Predictions option is unchecked, users will only see actual values.
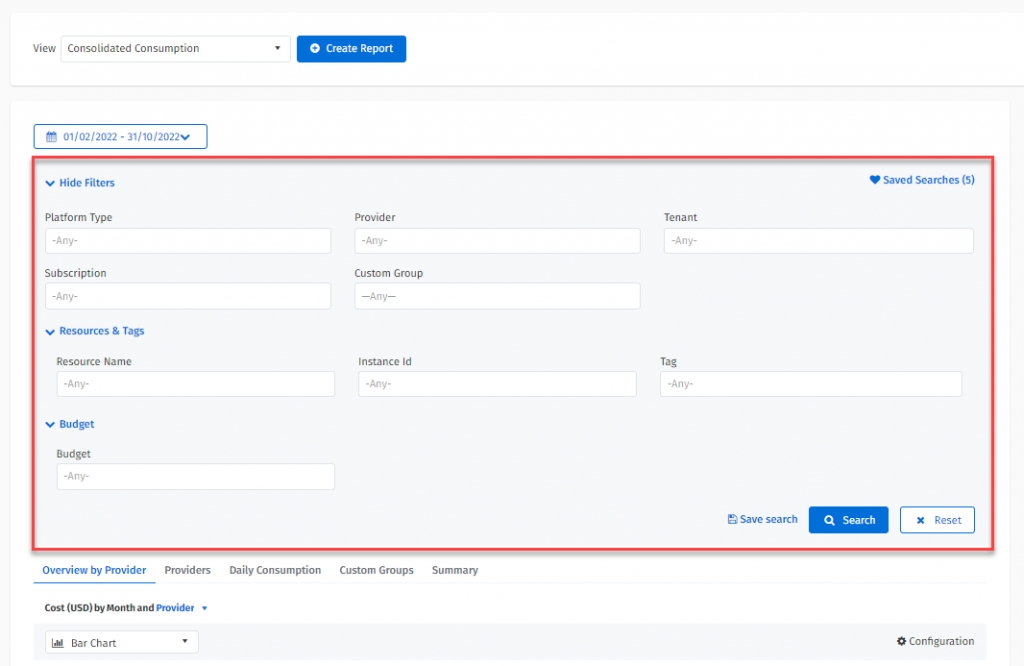
Each report allows users to filter data in a number of ways. Selecting filters and applying them will immediately change the data scope according to the filters selected. Filters apply to every page of a report.
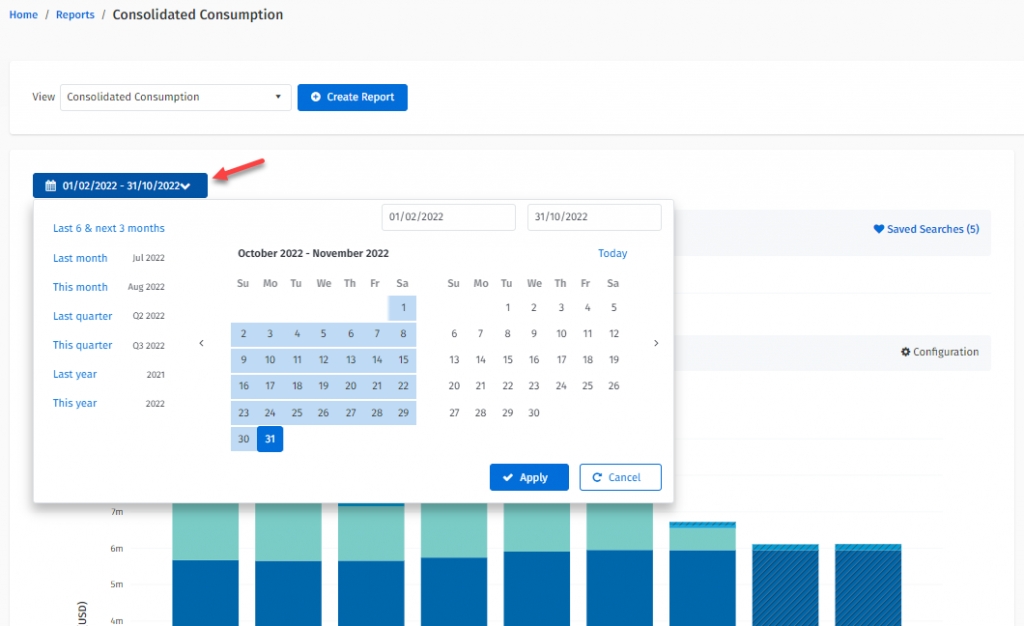
Date Filter: The date filter marked below allows you to define the time range of the data you want to see on the report.
The reset option sets the date range back to default. The default is 6 months back and 3 months forward from today’s date. The default time range adjusts to meet the first and last day of the month.
The AzureSimple Billing Consumption Details allows you to choose date ranges reflecting billing cycles instead of a start and end date.
Advanced Filtering: Each report provides users with the ability to filter data. The set of filters (depending on the available report data characteristics) available in the section shown below, allows users to select specific filter values and narrow down the report to the data they want.
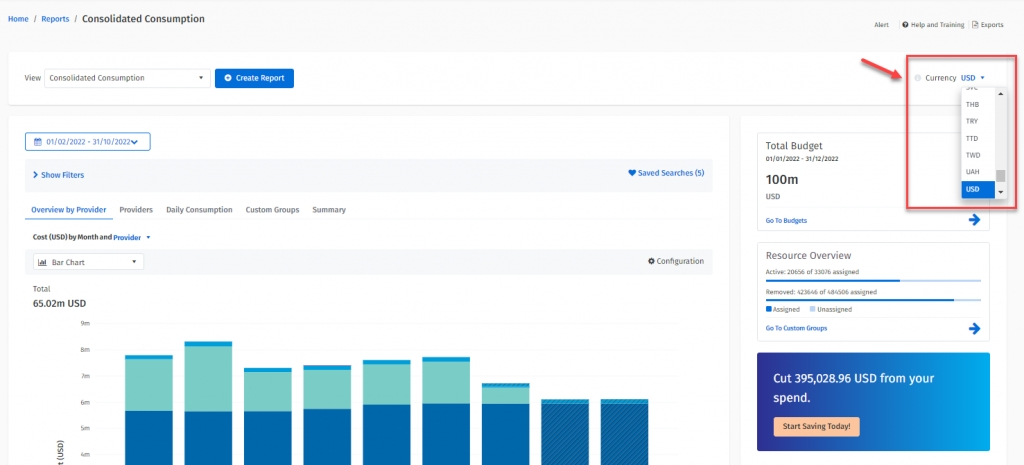
If a report provides consumption cost, then the currency of that cost is the currency defined in Budgets. The default currency is USD. To change the currency for all reports select the preferred currency from the list of available currencies.
If the currency selected is a different currency from the billing currency – the most up-to-date exchange rates are applied. The exchange rates are updated daily by SoftwareOne using an external public rate source.
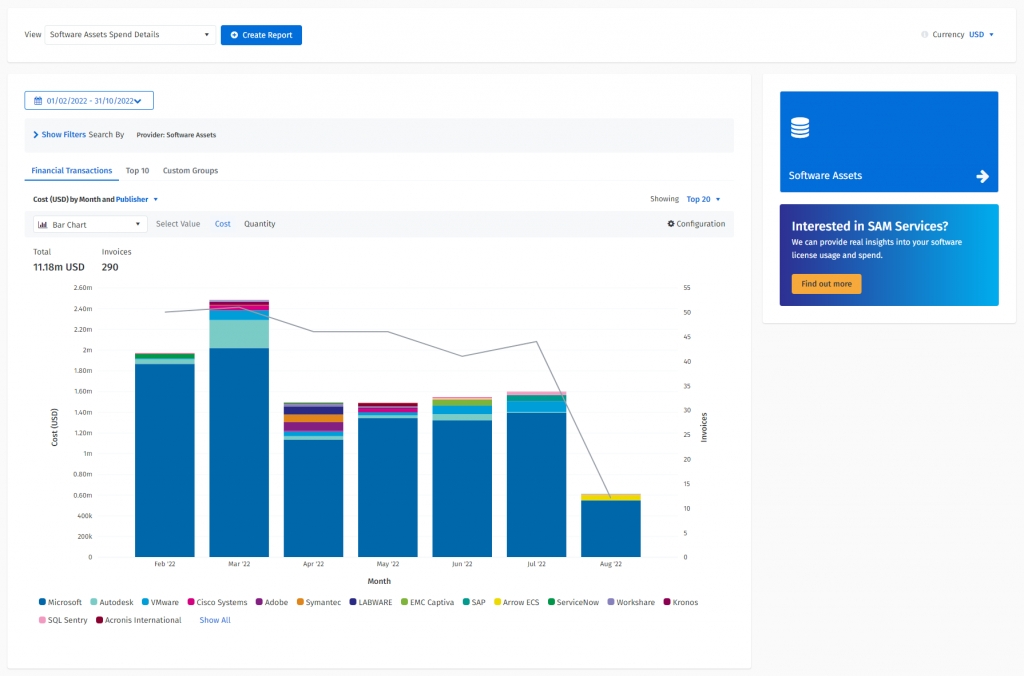
You can visualize and analyze your software assets spend. Each transaction is treated like a resource. You can assign it to a custom group, add tags or split the quantity between different business units (the same way you can with cloud resources). You can read how to enable transactions by going to Software Assets On-boarding.
Transactions can be viewed separately in the report we designed for that purpose: Software Assets Spend Details or along with cloud resources using our consolidated report.
To give you flexibility, you can decide if you want to view your transactions by cost or quantity.
There is built-in integration with Renewal Manager. This enables you to visualize your future software assets spend by connecting your transactions to planned renewals.
You can also view your transaction and cloud costs within Consolidated Reports.
You can view your transactions by:
Publisher
Product Family
License Model
Document Type (Invoice or Credit Memo)
PO Numbers
You can analyze the cost of the virtual resources that you manually added to the platform (see Resources). You can do this separately or combined with your provider costs.
To do so, open the Consolidated Consumption report from the dropdown. Virtual providers can be accessed using the Provider filter in the Consolidated Consumption report. To select the virtual provider, first expand the filter section and then select the virtual provider you added in Resources as shown below:
The virtual resource costs are treated the same as any other resource costs (such as Azure or AWS). You can analyze the cost of the virtual provider on its own.
Or in combination with your resource costs.
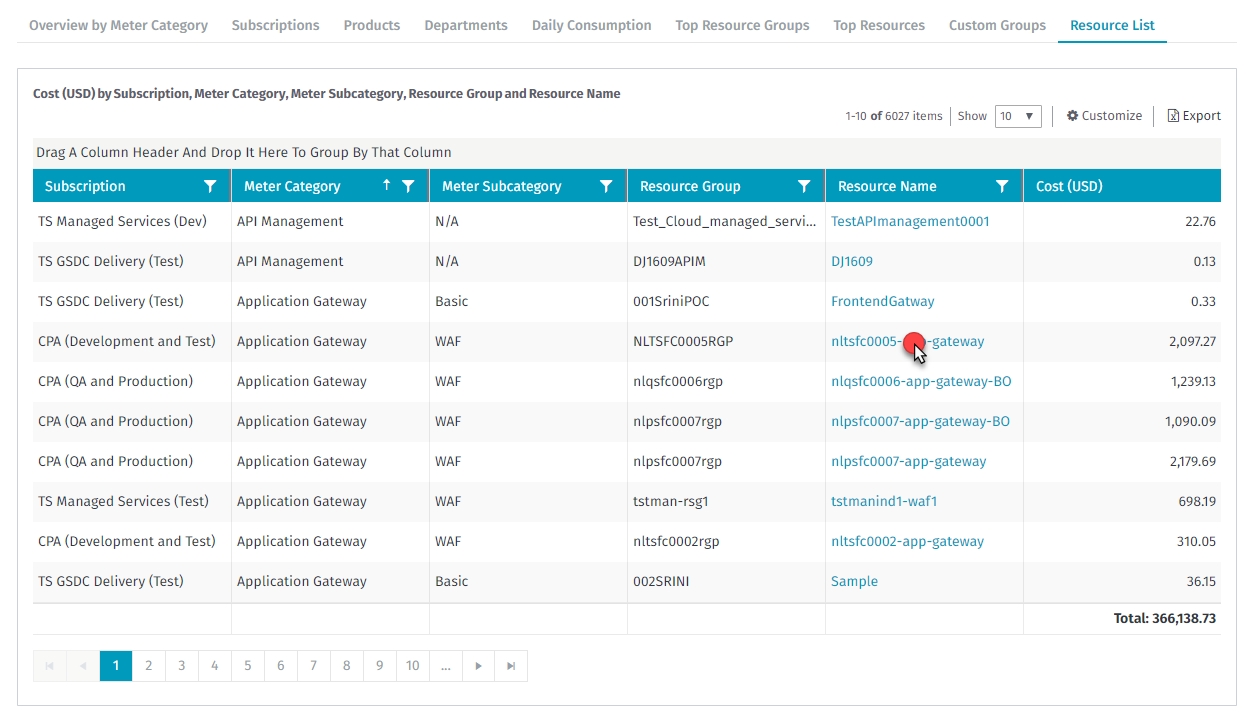
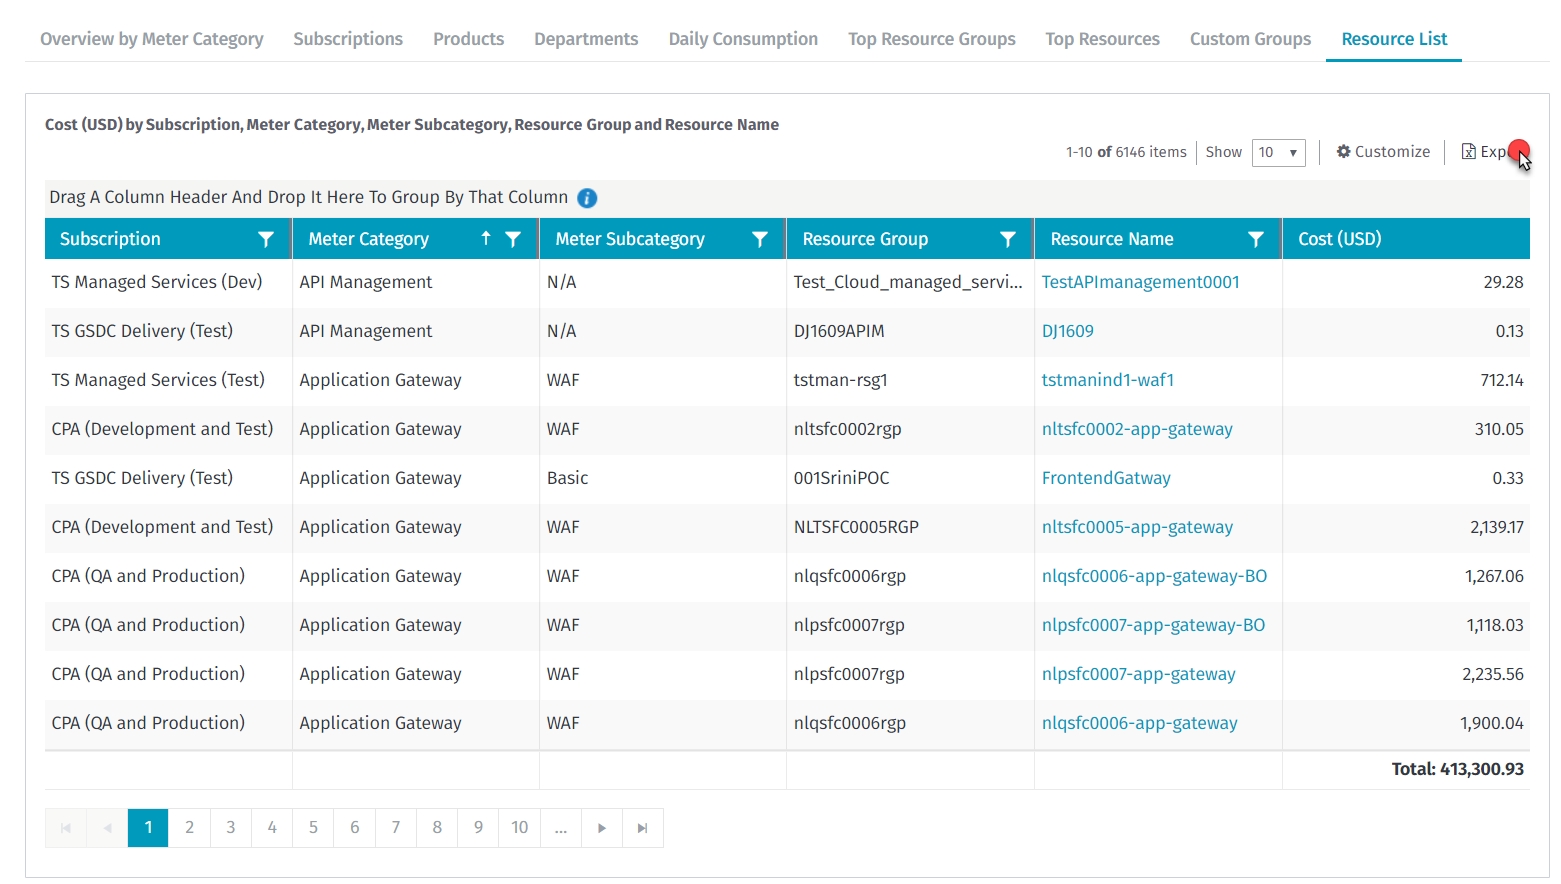
Most of the reports provide a list of consumption cost for each resource on the last page (within the date range you specified in the Date Filter). This detailed table can be exported to an Excel file.
To export the file, select Export and save the generated file on your system.
The file generated is compliant with the list of columns provided in the details table. Customize table columns before exporting to adjust the list of columns in the generated file.
Reservations help you save money by committing to a usage plan for multiple products, for example, Virtual Machines and storage.
Committing allows you to get a discount for resources you are using. RIs are one of the cost-saving strategies that can give you the biggest savings.
You can read more about other available cost optimization strategies in the topic.
The usage plans depend on the cloud provider. For information on the usage plans, see the and websites.
With the Marketplace Platform, you can manage cloud reservations that allow you to accomplish the most savings.
The platform gives you a central view to quickly check your reservation's health, and monitor savings, and utilization. This report is a part of our Spend Management Reporting. We enable reporting automatically when our system detects an RI purchase.
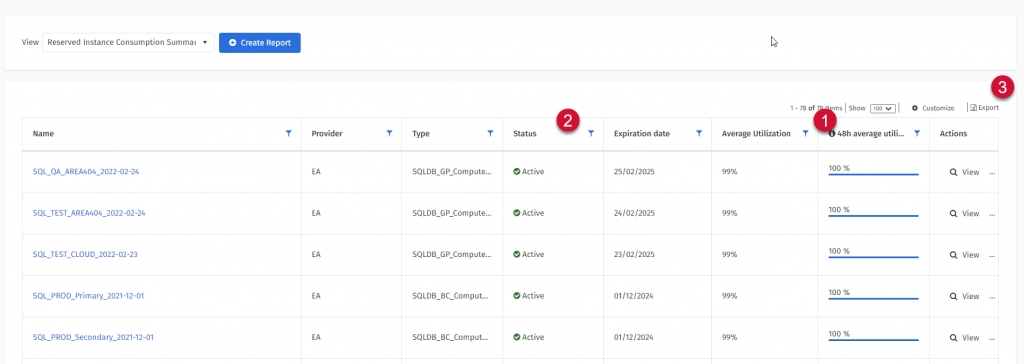
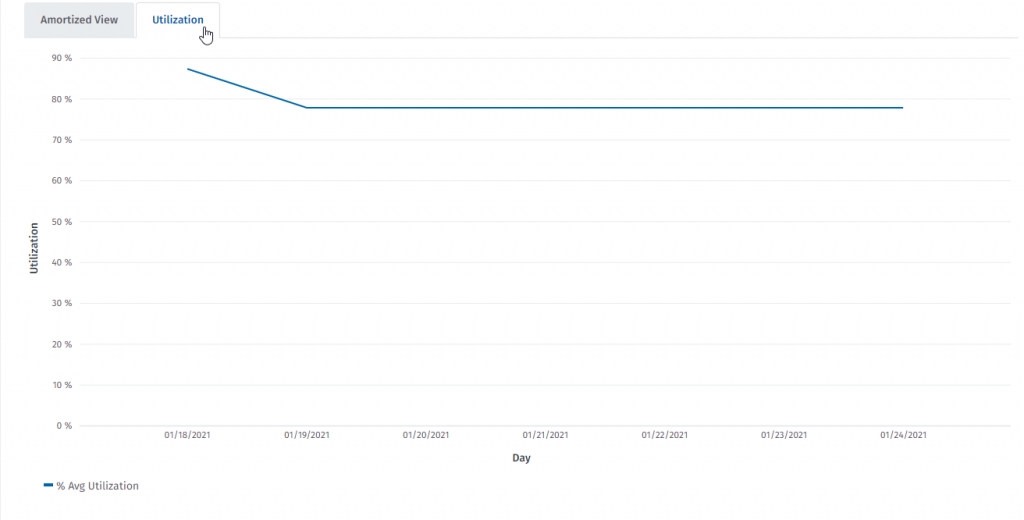
Recent average of your reservation utilization – you can check if there is any degradation in usage. If the average utilization is going down – resources that were utilizing RIs were likely deallocated.
The Client Portal keeps track of your historical purchases so you can compare values at any time. For monitoring purposes look at Active status only.
If you want to keep the reservation list for your internal records, you can export it to an XLS file.
The Client Portal transforms billing data in a way that allows you to effortlessly explore resources utilizing your RI at a given point in time.
Reservation details are exposed by the cloud provider.
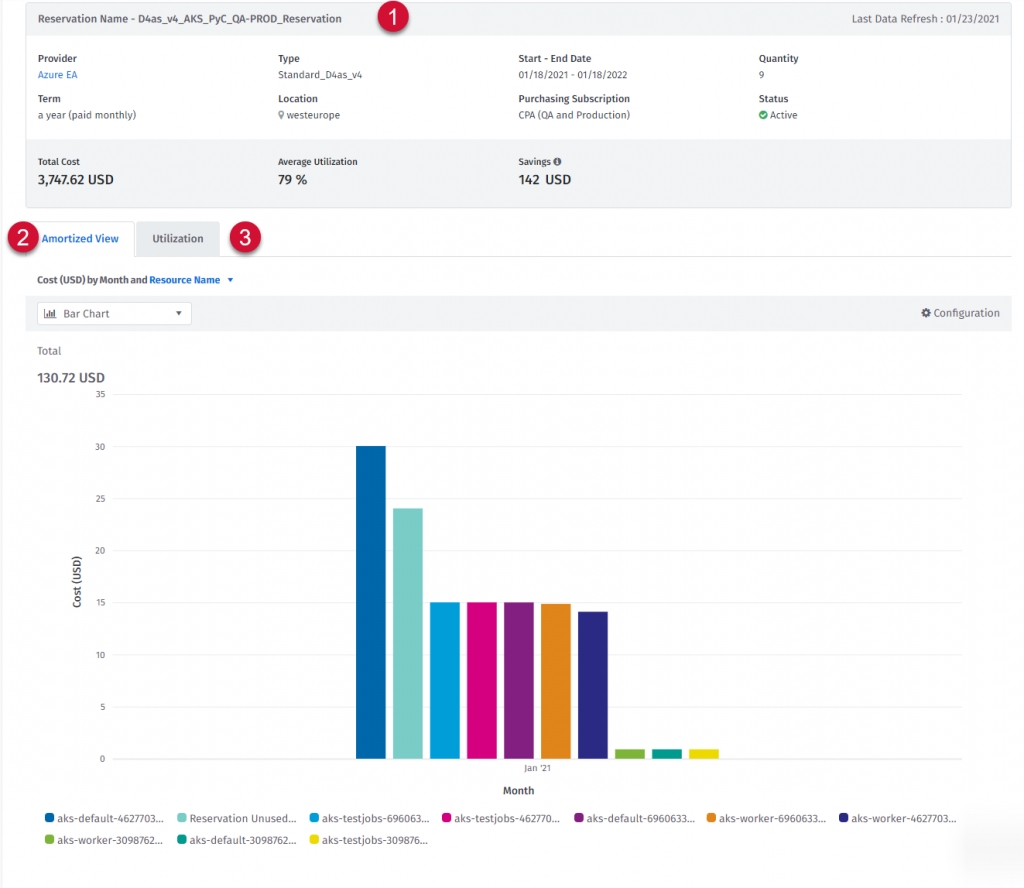
The Amortized View groups data by resource, so you can see which resources are using this Reserved Instance. You can “drill down” to a selected month to see daily distribution.
You will notice Reservation Unused Cost in the chart legend, which informs you if the full potential of your RI is not realized. You should keep this bar as low as possible (because of the delay in receiving data from cloud providers in the last 2 days you might see unused cost which is not accurate).
In the Utilization tab, you can monitor the daily utilization of your reservation.
The Client Portal creates resources for each reservation so that you can track costs in spend management, create budgets, or schedule a chargeback.
The lifetime of a resource is determined by the term, once expired resources will be marked as removed.
We have incorporated RI metadata into our prediction engine. We assume that an RI will be renewed (if you don’t cancel it) so you may see “Purchase” spikes in your predictions if enabled.
Additionally, monthly reservations will return predictions for every consecutive month.
We value your time, so we automatically created notifications for all your RI’s. As a result, we will send you an alert if the RI utilization drops below 80%.
If you want to receive an email or SMS, be sure to verify your subscription in the Consumption Section (1) of the Notification Hub.
When a Microsoft tenant has conditional access policies enabled and is moved to a SoftwareOne partner account, the Client Portal automated onboarding may not be able to integrate correctly.
For the Client Portal to work, the customer must manually configure their tenant so that the Client Portal can access it. Follow these steps to onboard the Client Portal.
Create the “PyraCloud (Azure)” Enterprise Application
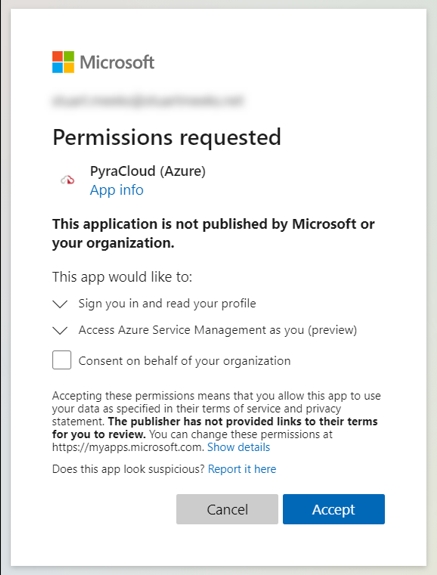
The first step is to perform consent. The Client Portal uses an Enterprise Application to access the customer tenant.
Important:
You should launch this link in an InPrivate/Incognito/Private window to ensure you are signing in to the correct tenant.
You must sign in with a user who has permission to perform consent.
Confirm the Enterprise Application Exists
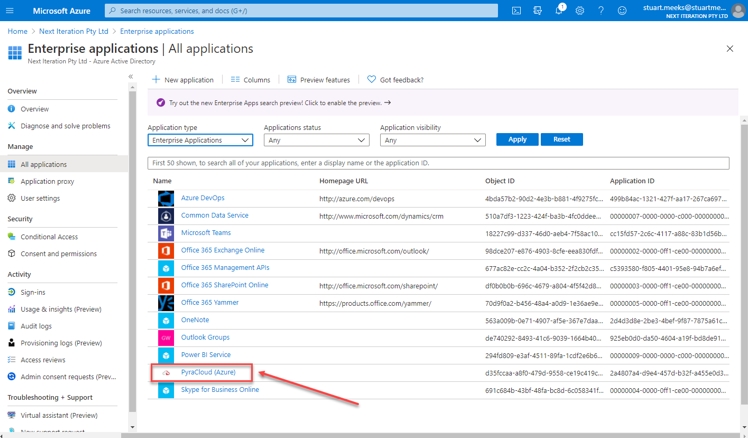
To confirm the “PyraCloud (Azure)” Enterprise Application exists, sign in to the Azure portal and navigate to Azure Active Directory -> Enterprise applications.
The “PyraCloud (Azure)” application should be visible in the list. If it is not visible, try searching for “pyra”.
Assign IAM Roles to the “PyraCloud (Azure)” Enterprise Application
the Client Portal requires the following roles in each Azure subscription being activated:
Reader: This role allows the Client Portal to import resources from your Azure subscription into the Client Portal. You can then manage these resources and tag them in the Tags and Resources features.
Tag Contributor: This role is required to synchronize tags to and from your Azure subscription. The Client Portal will only synchronize tags back to your Azure subscription if you select write-back of tags in Cloud Tenant Setup. The default setting is read-only.
Once completed, during the next scheduled synchronization, the Client Portal will be able to pull reservation utilization data.
To register for the Enterprise Application, use the following link:

