Utilization
Track your cloud resource usage.
Was this helpful?
Track your cloud resource usage.
Was this helpful?
The Utilization module allows you to track your cloud resource usage so you can determine which resources can be de-allocated or resized.
You can access the Utilization module by navigating to the main menu of the Client Portal and selecting Cloud tools > Utilization.
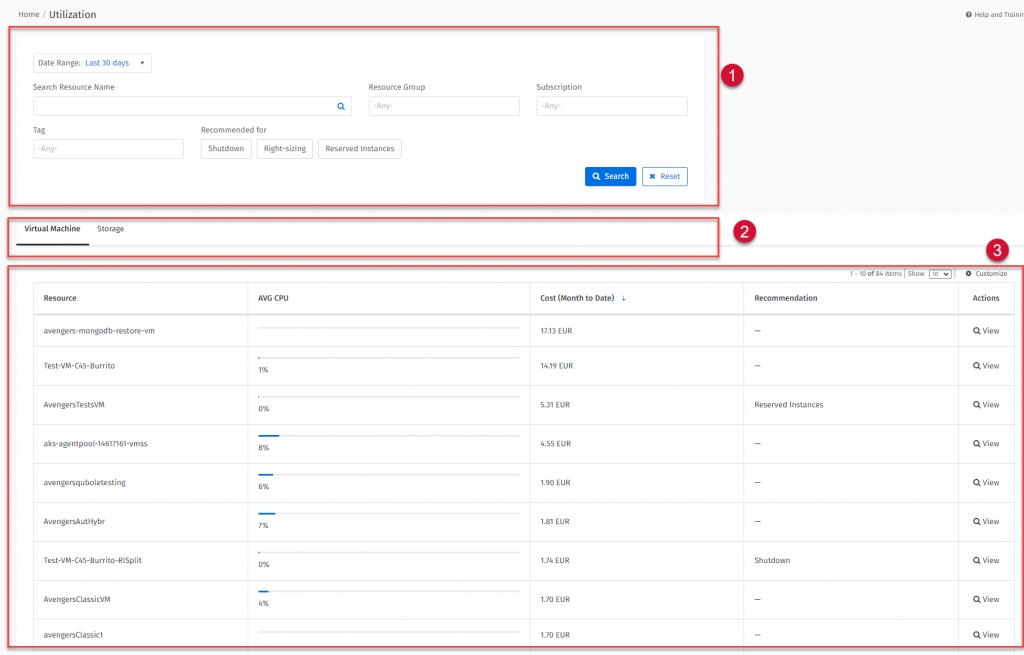
The Utilization page contains search filters and tabs that allow you to choose a resource type. When you search for a resource, your list of resources are displayed in the grid.
Search filters - You can search by relevant resource properties and additionally, you can filter resources by recommendations (if applicable). For example, you can review all resources recommended for “shutdown” and see if utilization is low.
Virtual Machine and Storage tabs - Utilization currently supports two resource types, Virtual Machines (that include Azure scale sets) and Storage accounts. Utilization supports both Azure and Amazon resources in one single unified view.
List of resources - On the main page you will see a table with a list of your cloud resources with the main metric selected – for Virtual Machines it is Average CPU, and for Storage Accounts it is Capacity. The table can be sorted by “all visible columns” so you can optimize your analysis.
You can navigate to details by clicking View on the Utilization page.
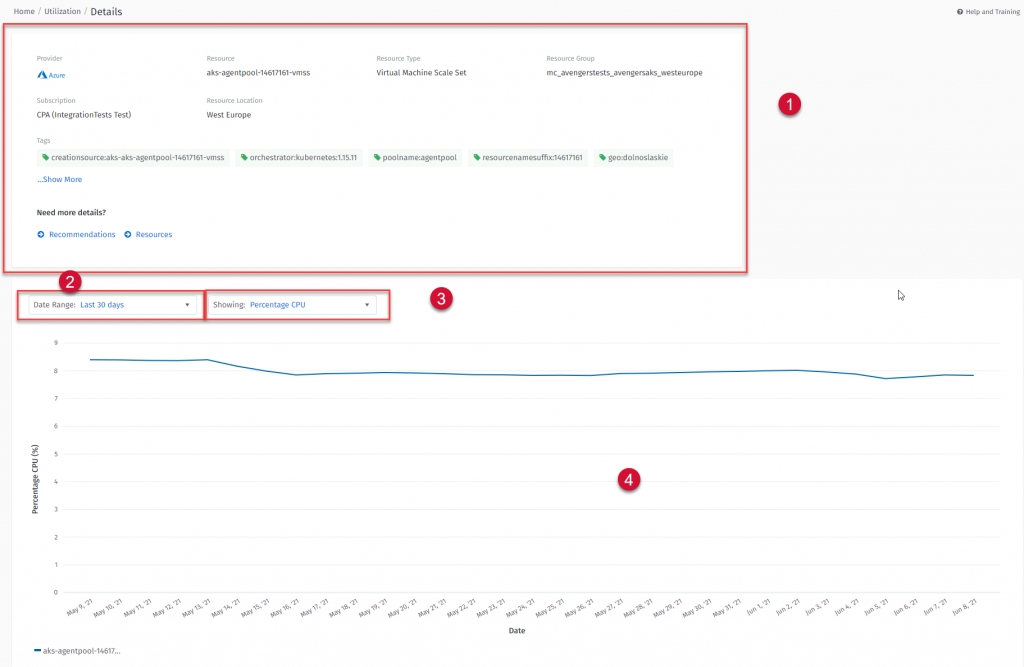
The page contains four main areas:
Resource Basic Information - This section contains information, such as group, subscription, provider, and tags. Additionally, you can navigate directly to the Recommendation module.
Date Range Selector - Currently, there are two types of selectors – 30 days and 7 days (older data is automatically removed). In “30 days” mode you see a daily aggregation chart (4) and in the 7 days chart you see hourly aggregation.
Metric Selector - This drop-down allows you to view available metrics. The module currently supports CPU and network traffic for Virtual Machines, and Capacity and Counters for storage accounts. After selecting, the metric chart is adjusted automatically.
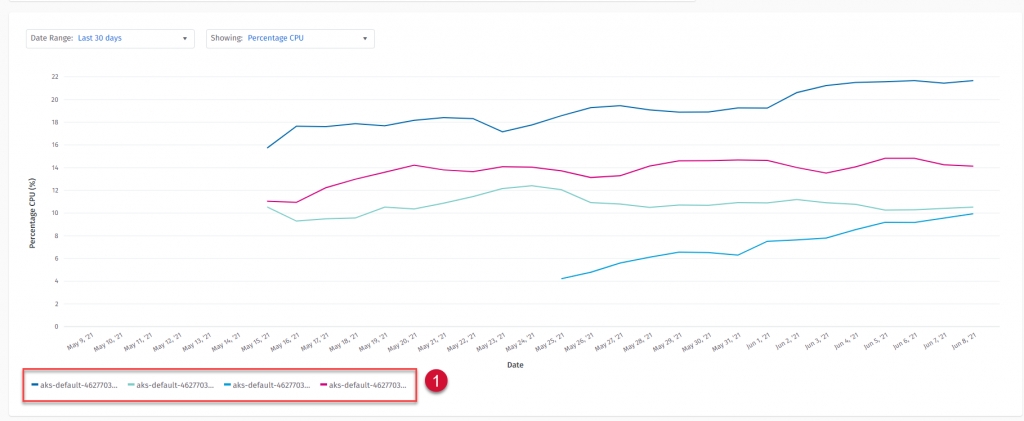
Chart Area - As well as plotting metrics data, the chart can also present scale set resources, so you can analyze multiple nodes running on scale set.
By clicking on the legend (1) you can show/hide scale set nodes.
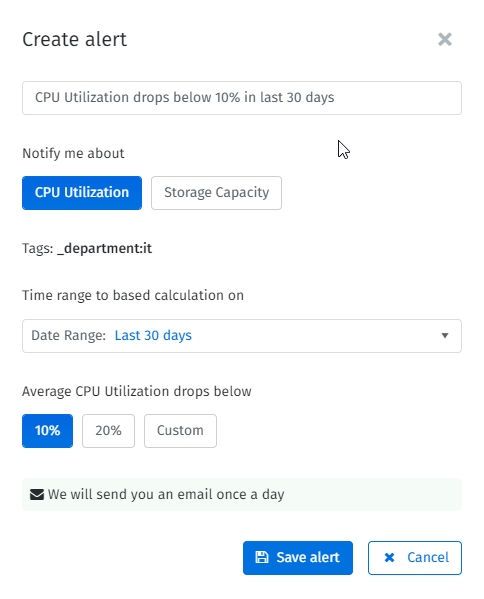
The utilization module supports custom alerts, so you can set up notifications based on the low utilization of your machines, or overutilization of your storage accounts.
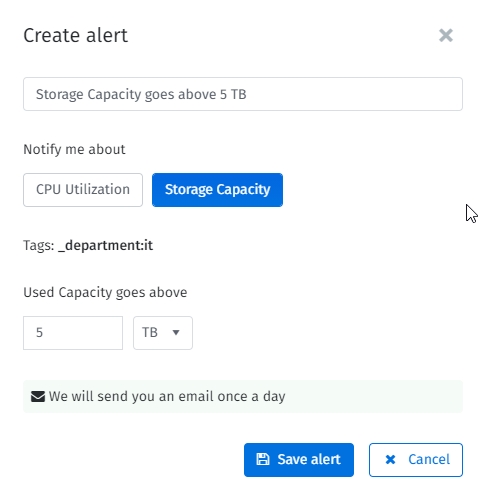
To create alerts, complete your search and then select Create Alert.
By default, the alert modal appears with Virtual Machine (CPU) notifications. You can configure notifications to be alerted if machine utilization (from your search criteria) drops below (10%, 20%, or a custom percentage).
You can also configure alerts based on the capacity of the storage accounts. If it grows above a defined threshold you will then be notified. The alerts are generated once per day at 5:00 a.m. UTC
If the utilization module is not able to pull utilization metrics, you will see the following message:
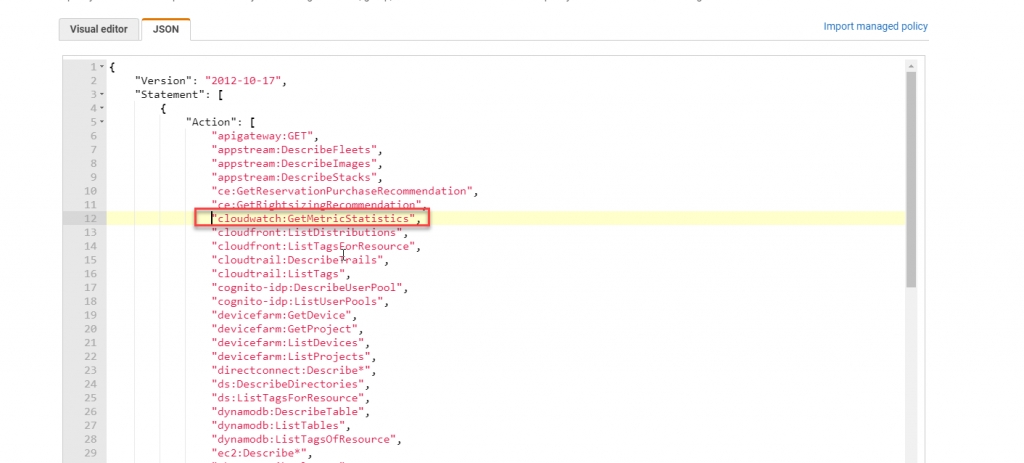
Utilization uses CloudWatch to pull metrics. If you see the above message, it means CloudWatch was not assigned to PyraCloudRole.
Follow these steps to resolve this issue:
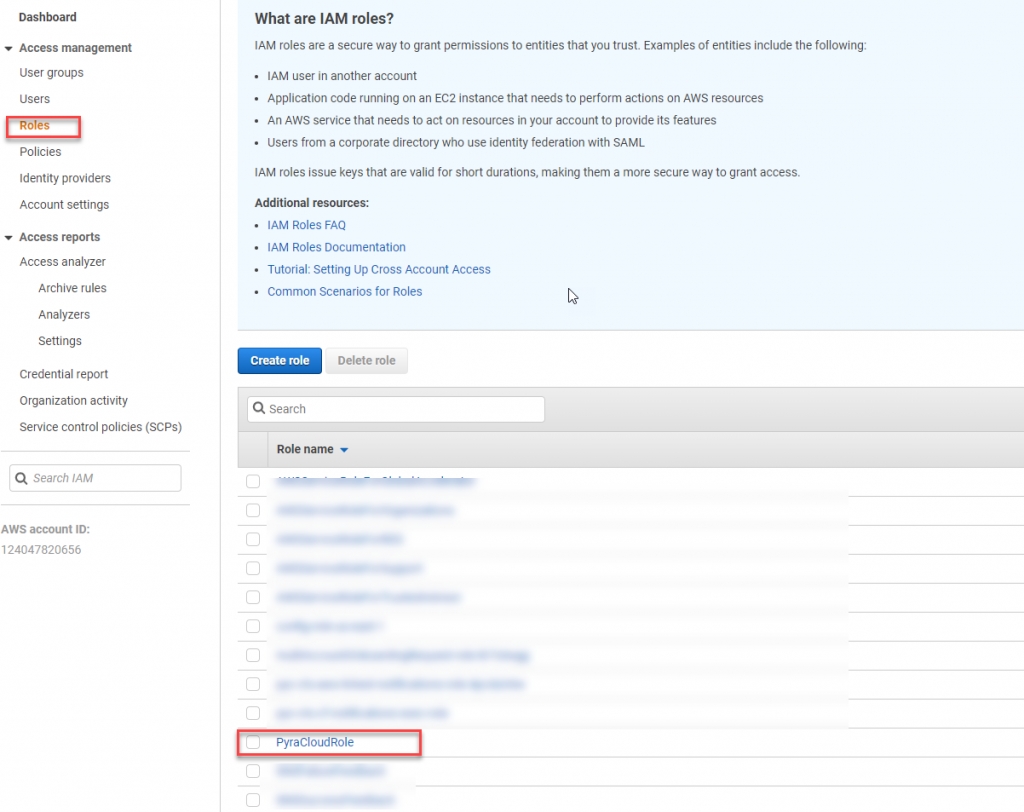
Open the AWS Console and navigate to IAM.
Locate PyraCloudRole.
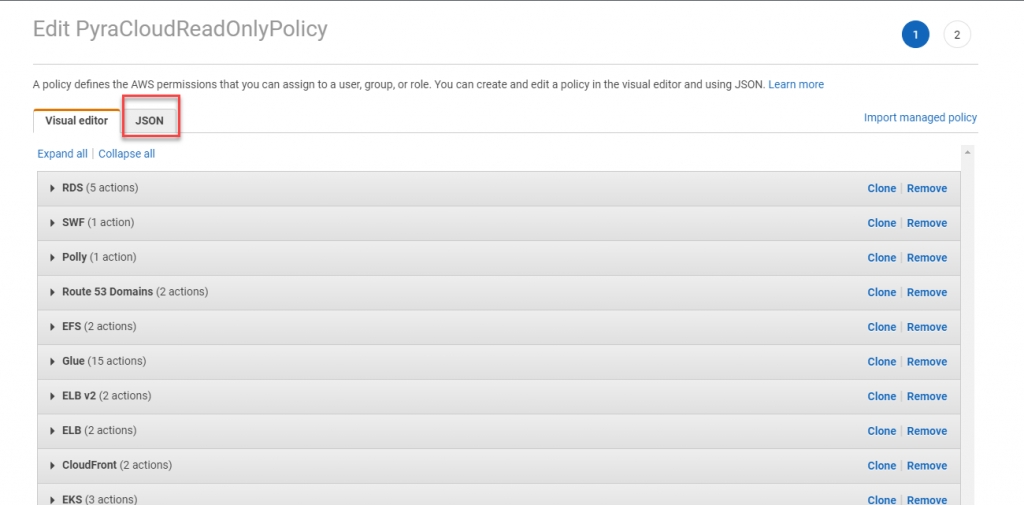
In the role, click PyraCloud ReadOnlyPolicy.
Click Edit policy.
Switch to JSON view.
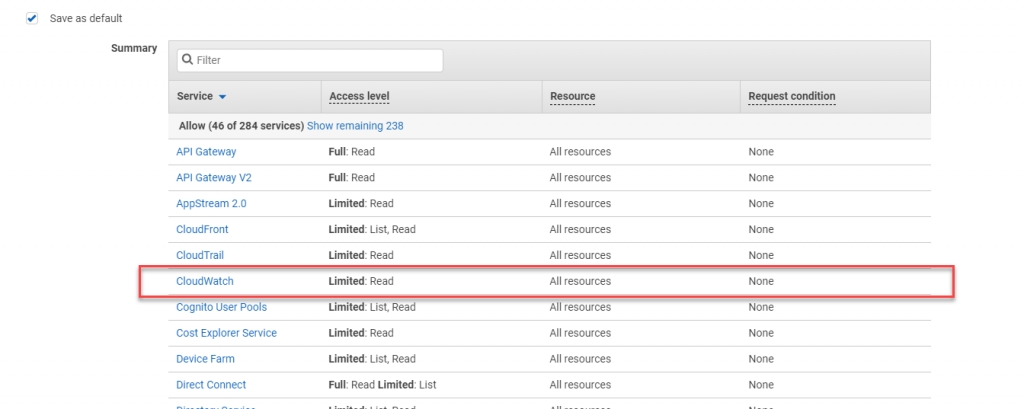
In the editor, add cloudwatch:GetMetricStatistics and click Review.
In the review summary, you should see CloudWatch permission.
Save your changes.
If using AWS Organizations, repeat these steps for all linked accounts. Utilization synchronizes data every hour, so your utilization metrics will be synchronized with the Client Portal during the next sync.

