Service Provider Dashboard
View and generate reports for your Microsoft SPLA contract.
Last updated
Was this helpful?
View and generate reports for your Microsoft SPLA contract.
Last updated
Was this helpful?
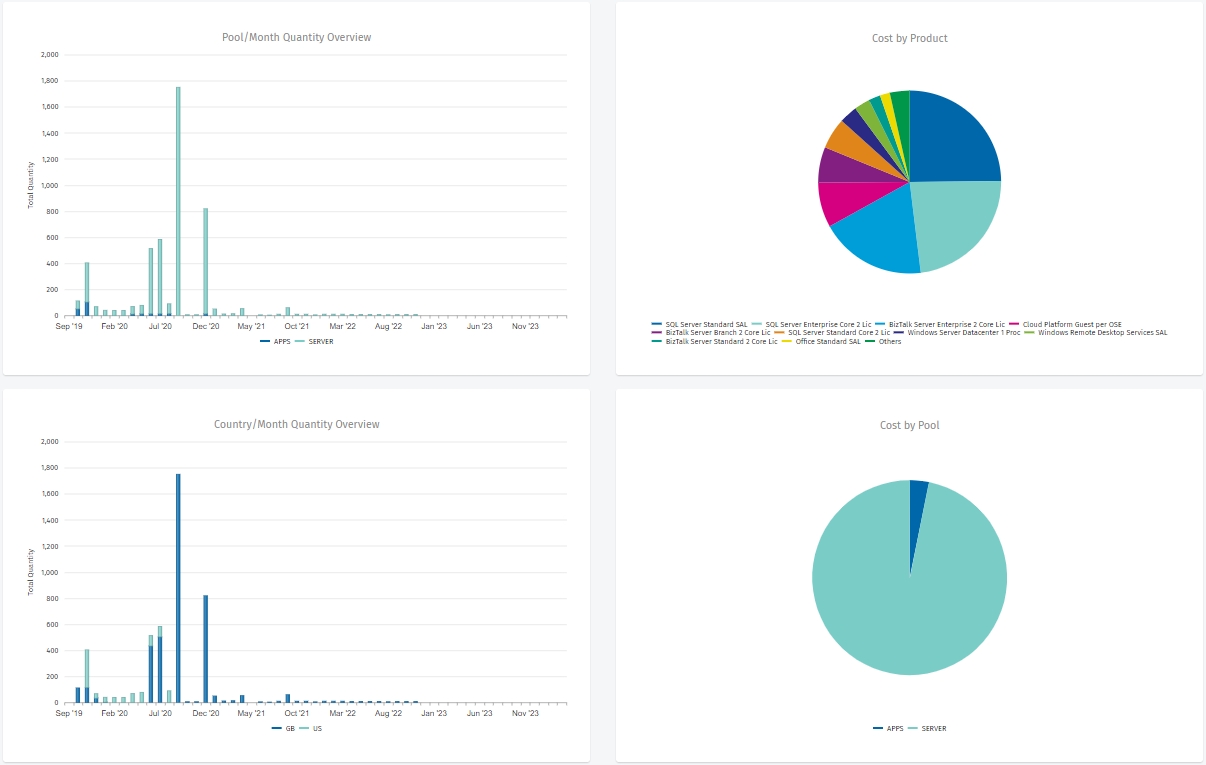
The Service Provider Dashboard allows you to visualize your Service Provider Licensee Agreement (SPLA) contract and its cost-related data.
You can access the dashboard by navigating to the main menu of the Client Portal and selecting Procurement > Service Provider Dashboard.
The Dashboard page is organized into various sections, comprising filters and a display area for data visualization.
On the dashboard, you can select a date range for your SPLA report and use filter options to control the data you want to visualize. You can filter by currency, agreements, and contracts, and use Show more options to select the advanced Report and Product filters. You can also choose if you want to show the total quantity and the Product/Month graph on the dashboard.
After you've applied the filters, click Submit. The following data will be displayed on the dashboard:
The cost of monthly usage by pool.
The distribution of costs by product.
The monthly costs by country.
The distribution of costs by pool.
After the data appears, you can further refine your filters by clicking on any legend within a diagram. To adjust or clear your current filters, click Reset or Remove filters, respectively.
To export the current page as a PDF, click Export to PDF in the filter options. The file will be downloaded automatically to your system.

