Spend Reports - Consumption Overview
You can use the Client Portal to get a comprehensive consumption overview of your cloud usage and cost.
The Consumption Overview feature is a set of functionalities that enable detailed spend analysis. The information is based on billing data fetched daily from a variety of providers, such as Azure, Amazon Web Services (AWS), Office 365, and Software Assets.
The consolidation allows you to analyze spend across multiple platforms in a single view. You can also:
Access multiple analytic reports and browse consumption cost information in easy-to-use interactive charts. The analysis is extended by leveraging information from other modules.
Analyze spend per the Custom Groups or Budgets.
Accessing Consumption Overview
To access Consumption Overview, navigate to Cloud tools > Consumption Overview. The Consolidated Consumption page opens.
Understanding the report data
A report can consist of multiple pages. A single page can contain multiple charts or tables that provide report data. The data depends on the filters set in the date filter and filter section.
Understanding the drill down and filter by functionalities
You can use the drill-down functionality to see more granular data on the selected cost. As an example, you can see the cost per day when you drill down on a specific month.
You can use the Filter by functionality to set the selected data item as a report filter. You will then only see this information in the rest of the report charts.
Drilling down on the data
The drill-down option allows very precise data analysis. Most of the reports available in Consumption Overview have been built with a set of hierarchical dimensions that allow you to perform the drill-down action by clicking on an area in the chart.
The below screenshots show a drill-down scenario.
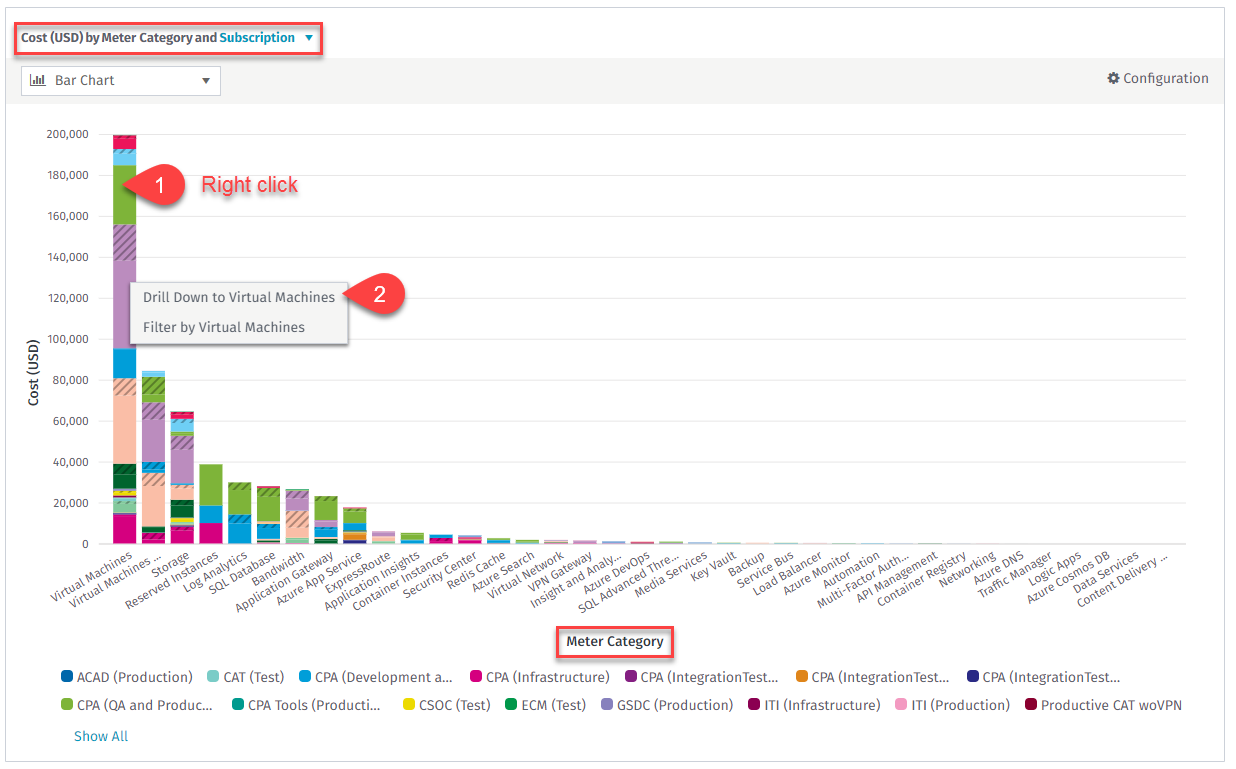
Choose a meter category, right-click on its data bar, and select the drill-down option from the context menu.
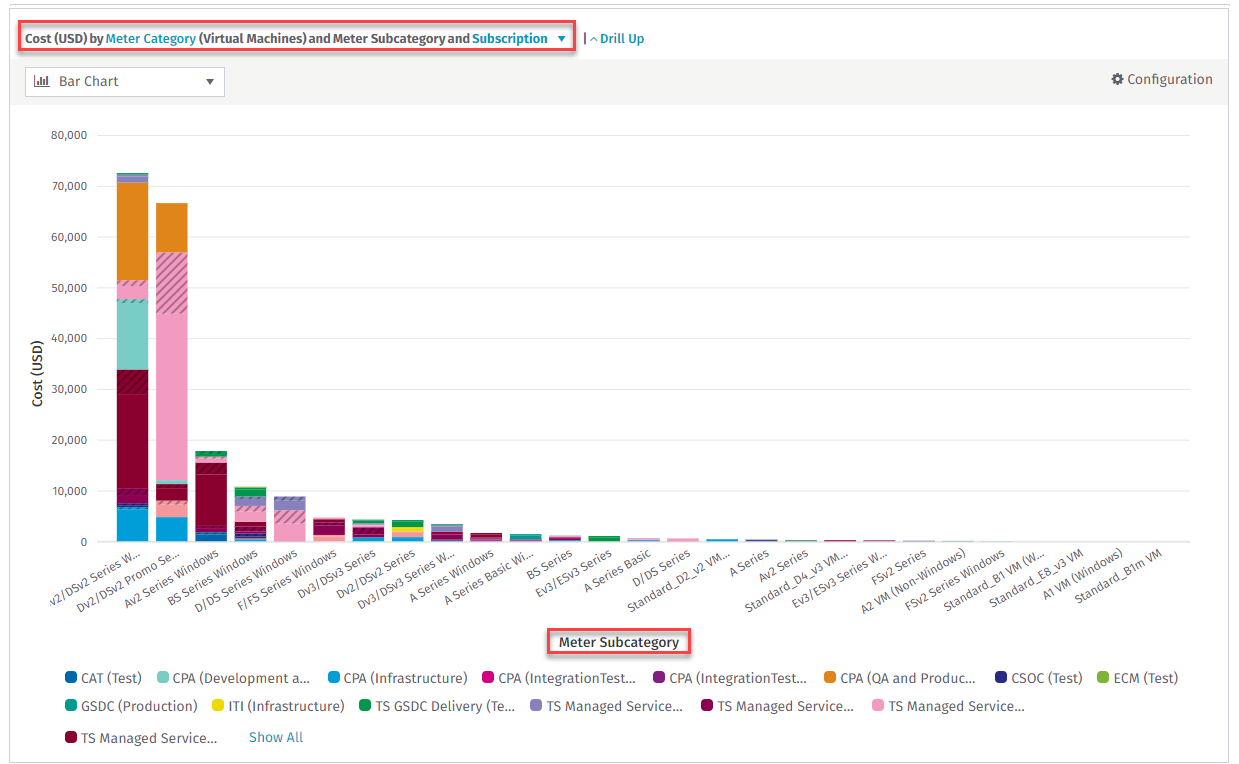
As a result, the cost chart of the meter subcategories, which are subcategories that exist under the selected meter category will be displayed. The sum of the cost of the meter subcategories is equal to the selected meter category cost. You can continue drilling down if there is another lower-level dimension provided for that chart (meter name in that case).
Please note the current view and horizontal axis descriptions. These help identify the hierarchy level that you are currently on.
Use the drill-up option to go back to the upper level of the hierarchy. The drill-down functionality provides more details of the consumption cost. Such analysis is especially helpful when searching for potential consumption anomalies.
Filter Report to Selected Data Item
In some cases, you might need to narrow the data context to a single data item (meter category, subscription, resource, etc.). Instead of setting an item as a filter, users can use the Filter by…option. This option works similarly to the drill-down option.
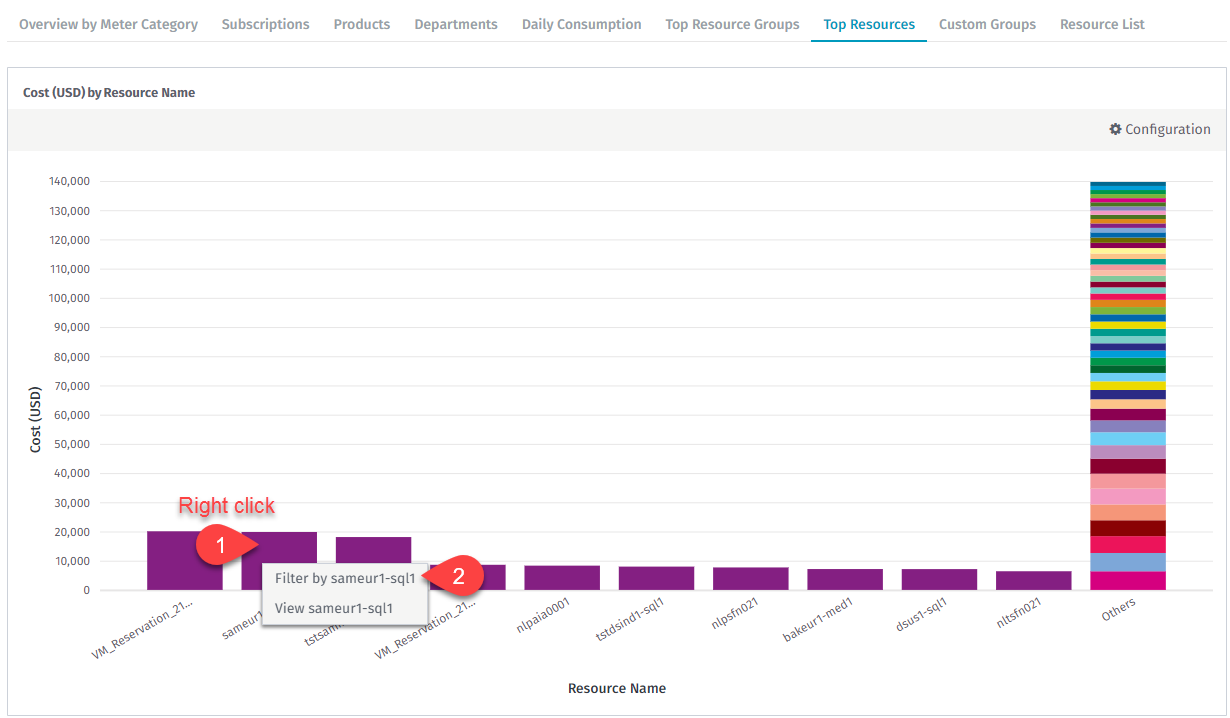
This action will set the selected resource as a filter.
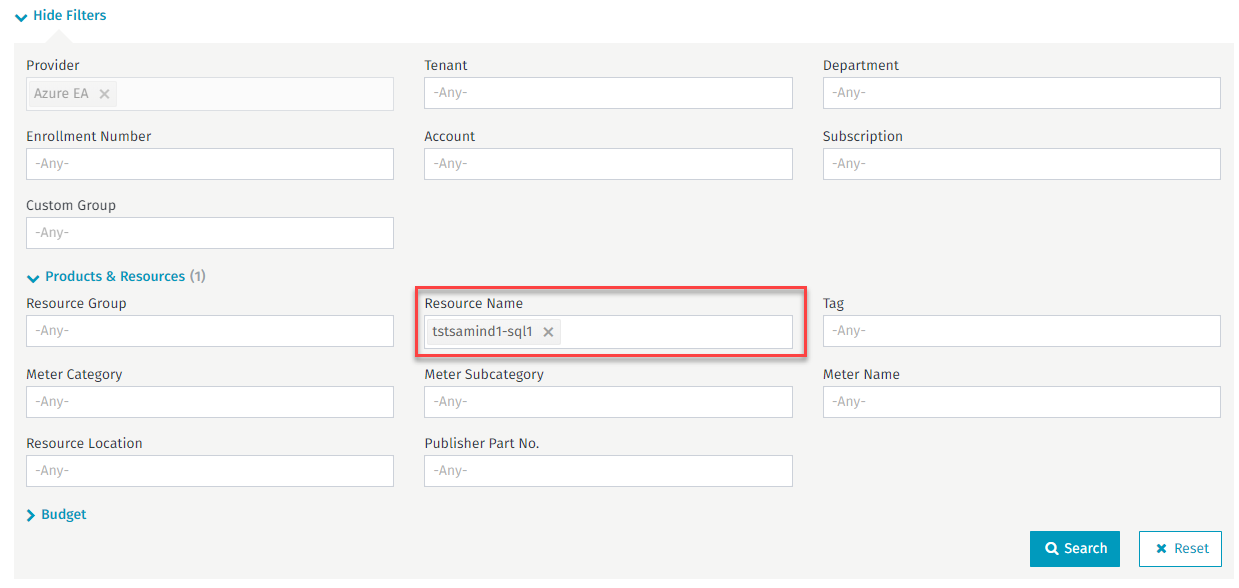
Now the entire report has data scoped to this single resource. You can use any page of the report to analyze its consumption.
Slicing and grouping the consumption data
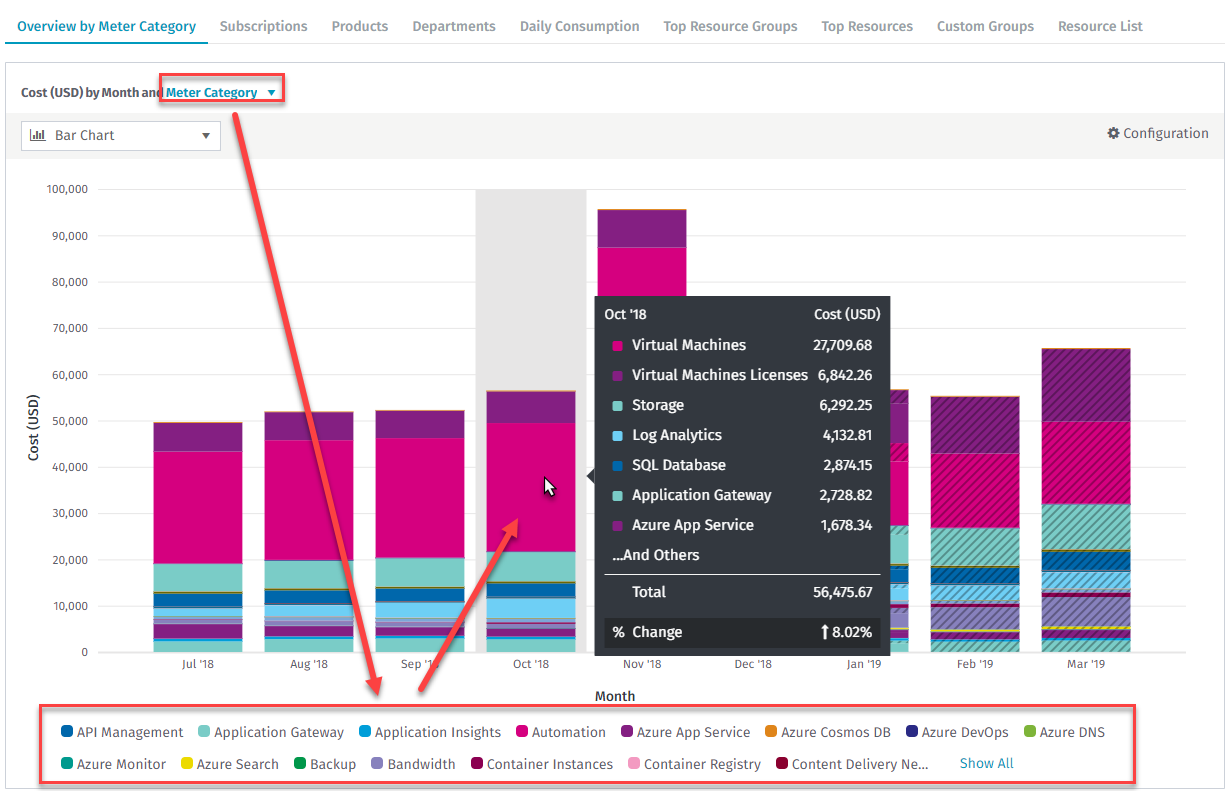
Selected report charts have the ability to slice data with the configured legend. The legend is an additional dimension added to data that slices the consumption values, for example, monthly consumption).
The following is an example of monthly consumption sliced with the meter category legend dimension.
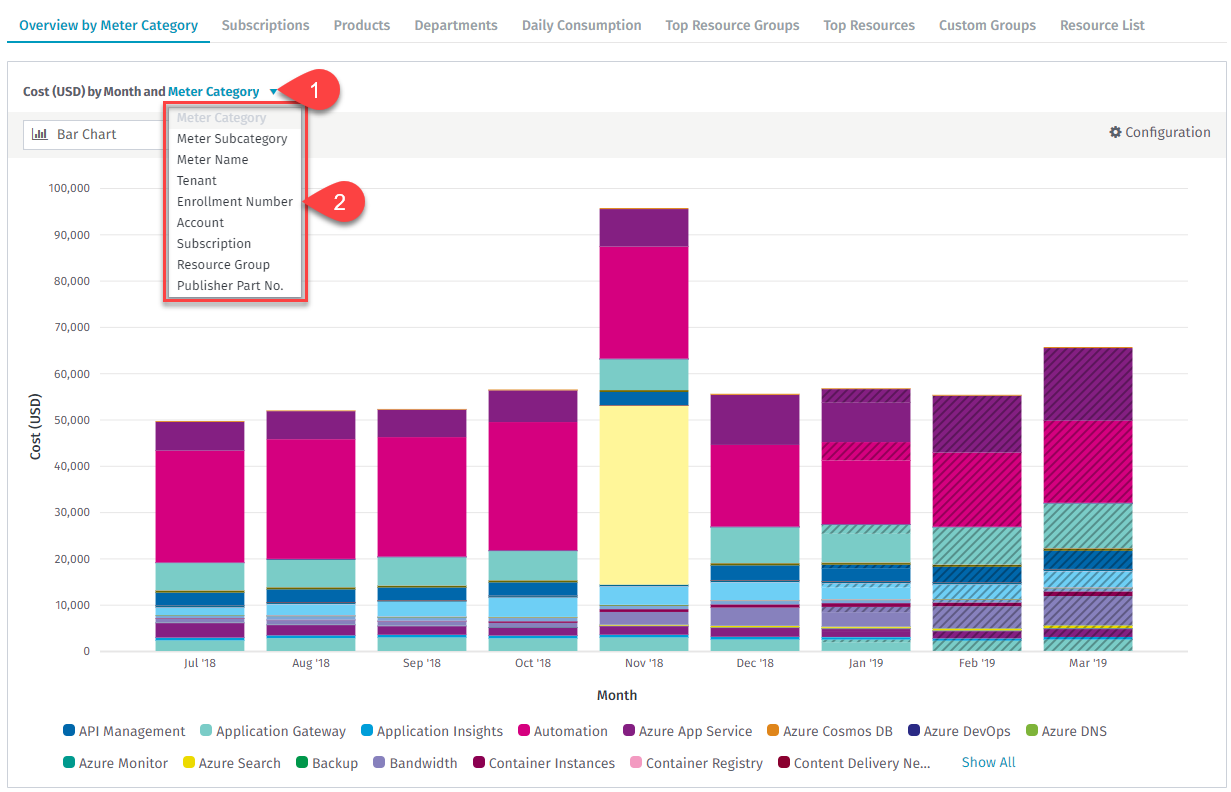
You can change the legend dimension by choosing the legend picker (1) and selecting another dimension (2).
Changing the chart types
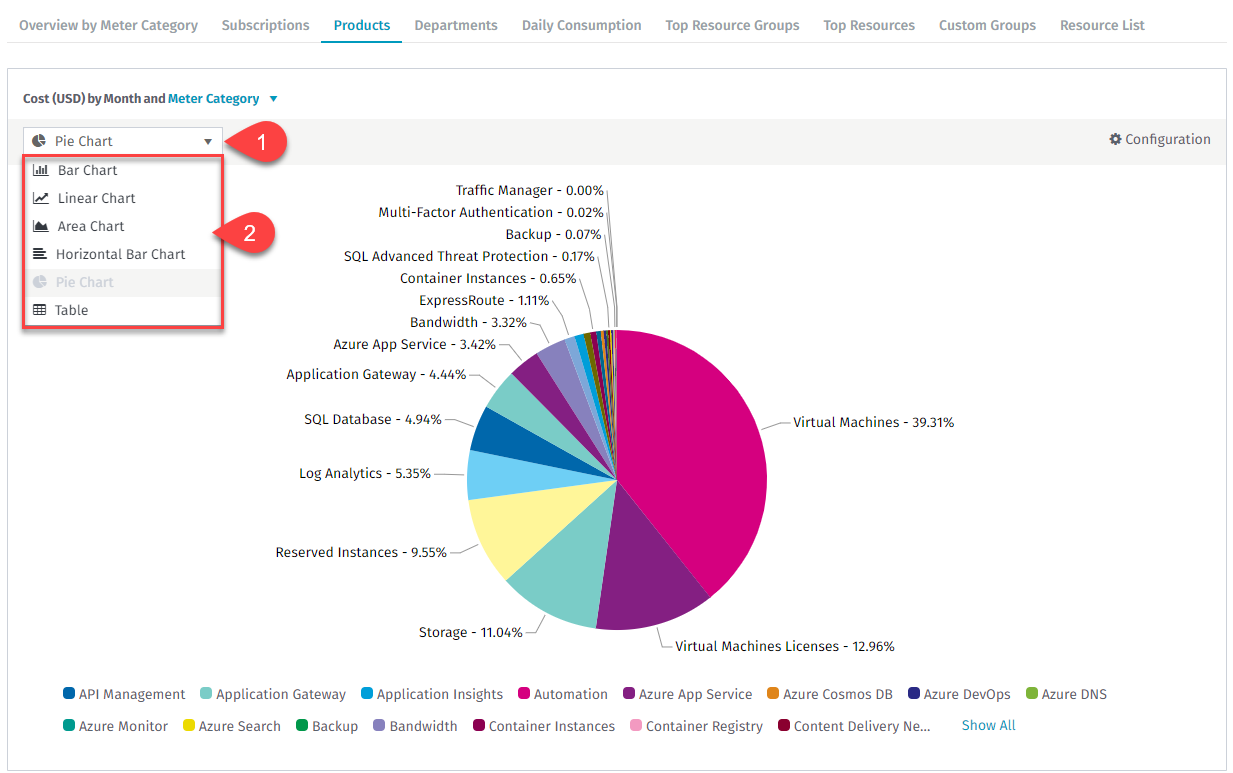
You can switch to different chart types or display data as a table to suit your preference.The following data visualization types are available:
Vertical bar chart
Linear chart
Area chart
Horizontal bar chart
Pie chart
Table
To change the visualization type, select the dropdown (1) and select the visualization type (2).
Understanding the resource details
If a chart provides resource data, you can navigate to resource details which are available in Resources. When a chart or a table is displayed, you can select the resource name.
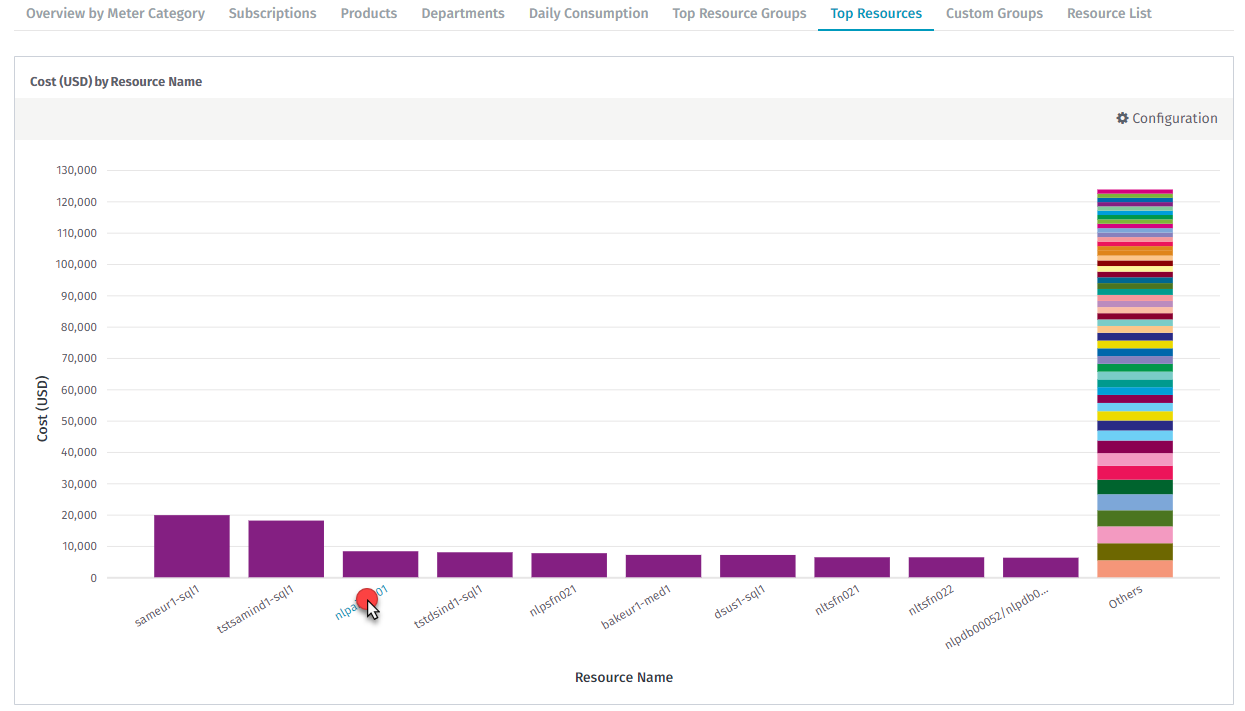
Such navigation is also available when displaying a table.
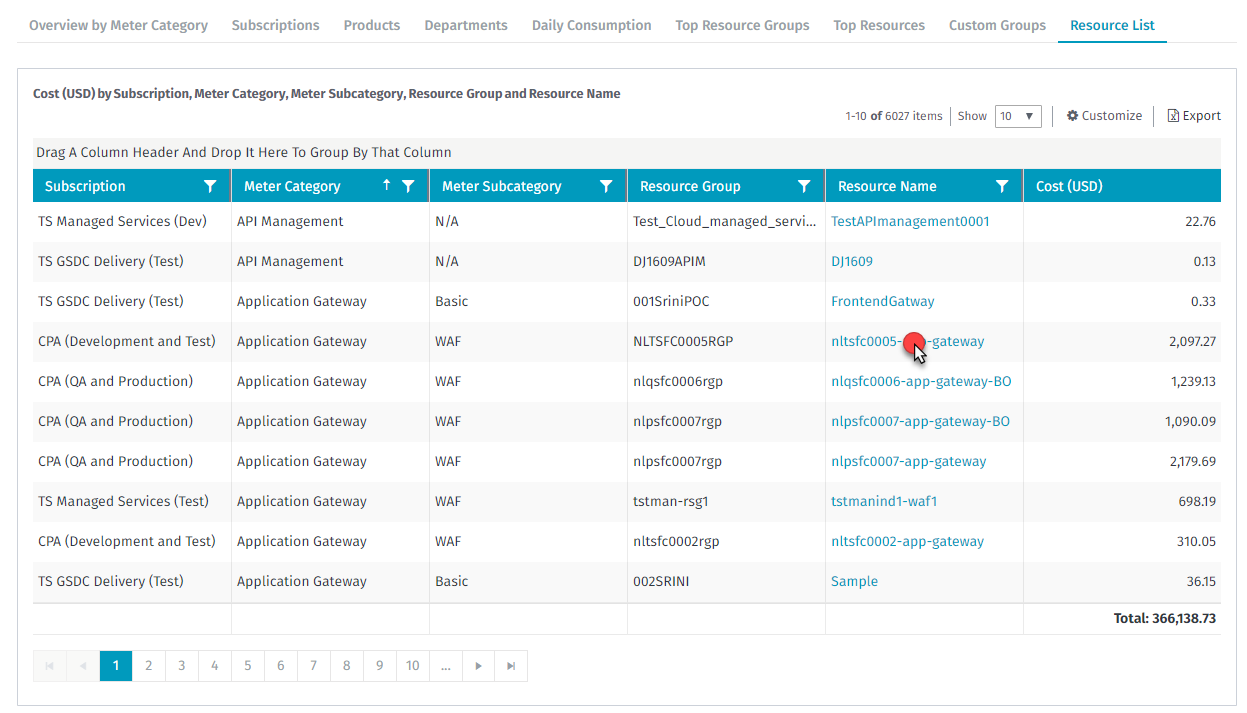
The selected resource details are displayed in a new Resources window.
Predicting spend
Most of the report charts provide actual and predicted values. Predictions are calculated based on the most recent actual values. Users will see predicted values for the data corresponding to the future time scope, with reference to the current date (if the scope of the time set in the date filter includes future days).
Below is an example of a chart that includes predicted values.
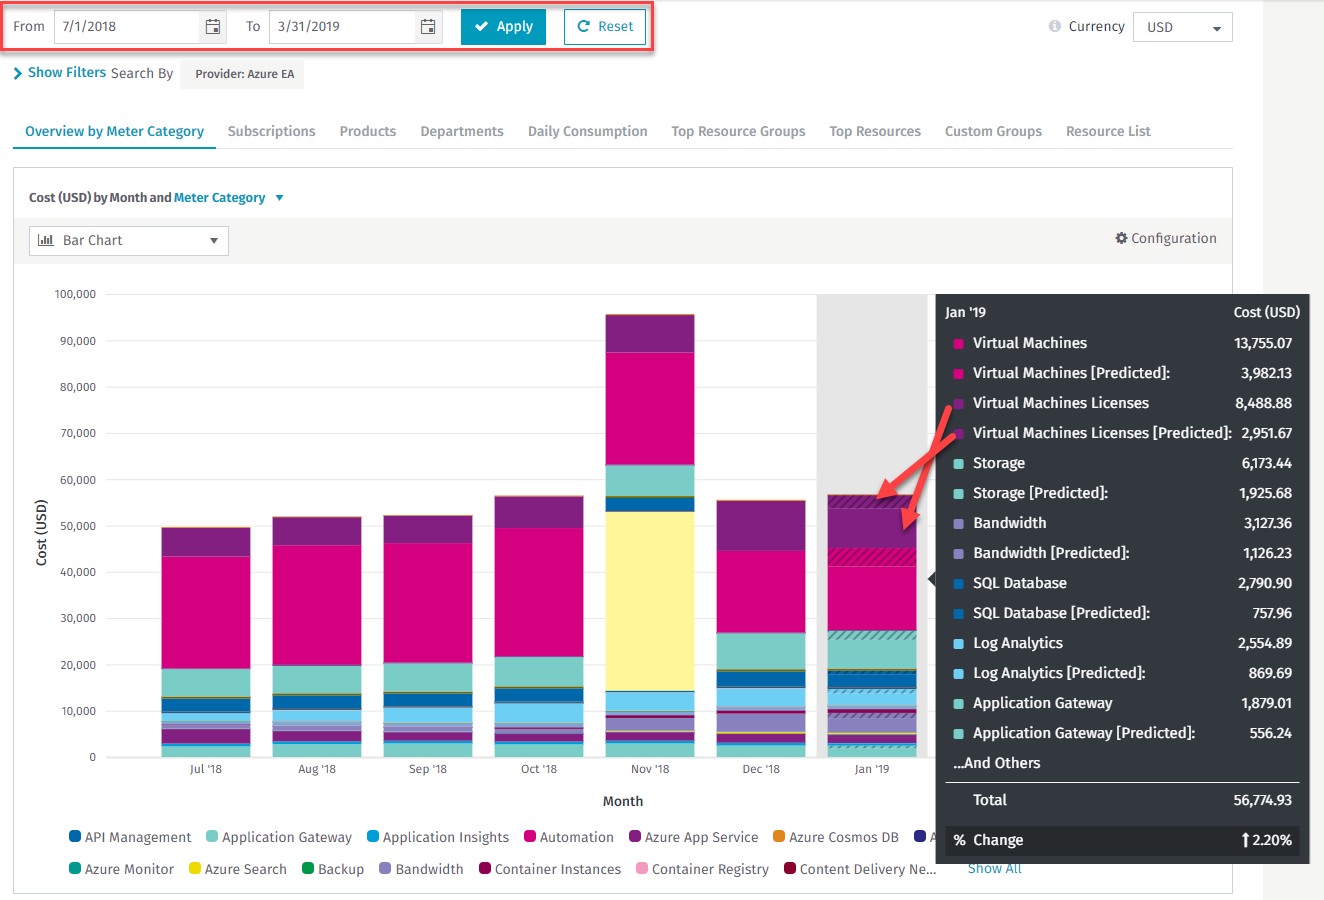
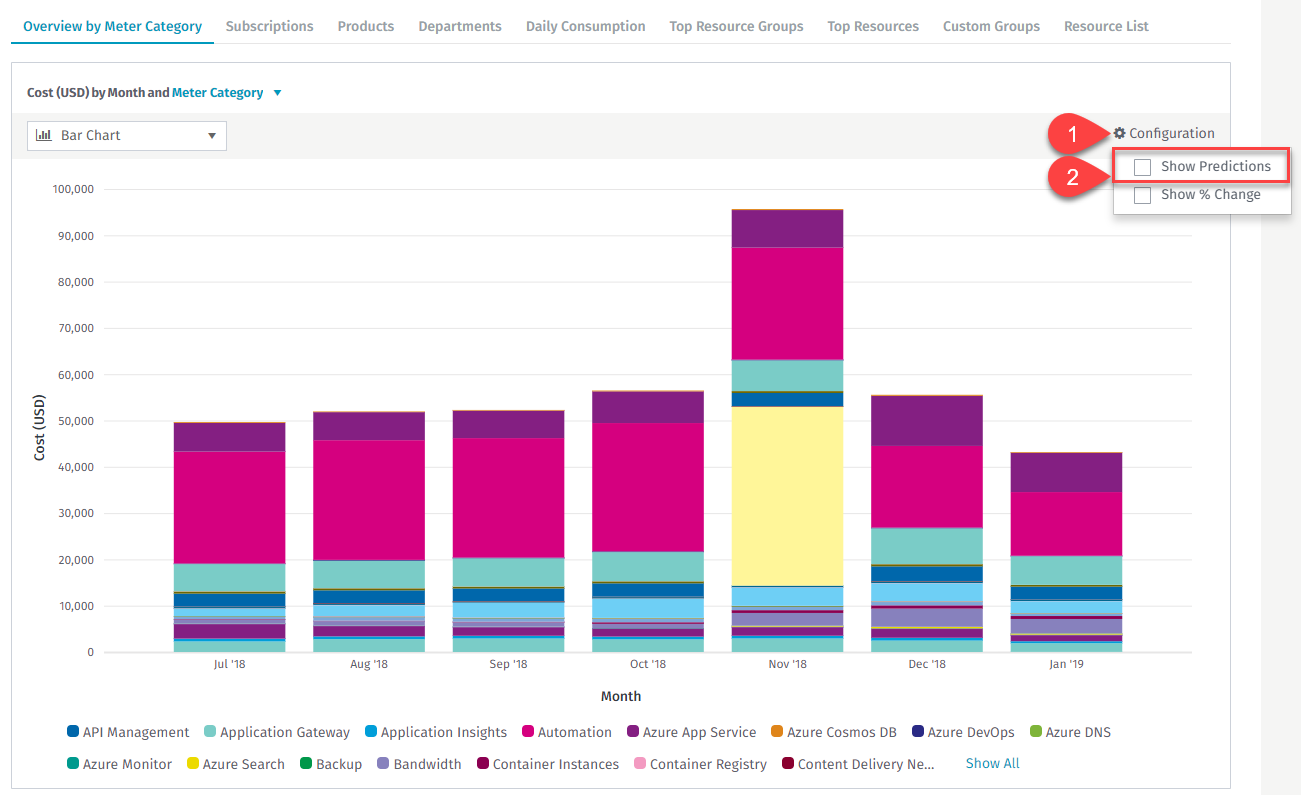
Predictions can be disabled for a chart. Use the configuration option shown below. If the Show Predictions option is unchecked, users will only see actual values.
Filtering the data
Each report allows users to filter data in a number of ways. Selecting filters and applying them will immediately change the data scope according to the filters selected. Filters apply to every page of a report.
Date Filter: The date filter marked below allows you to define the time range of the data you want to see on the report.
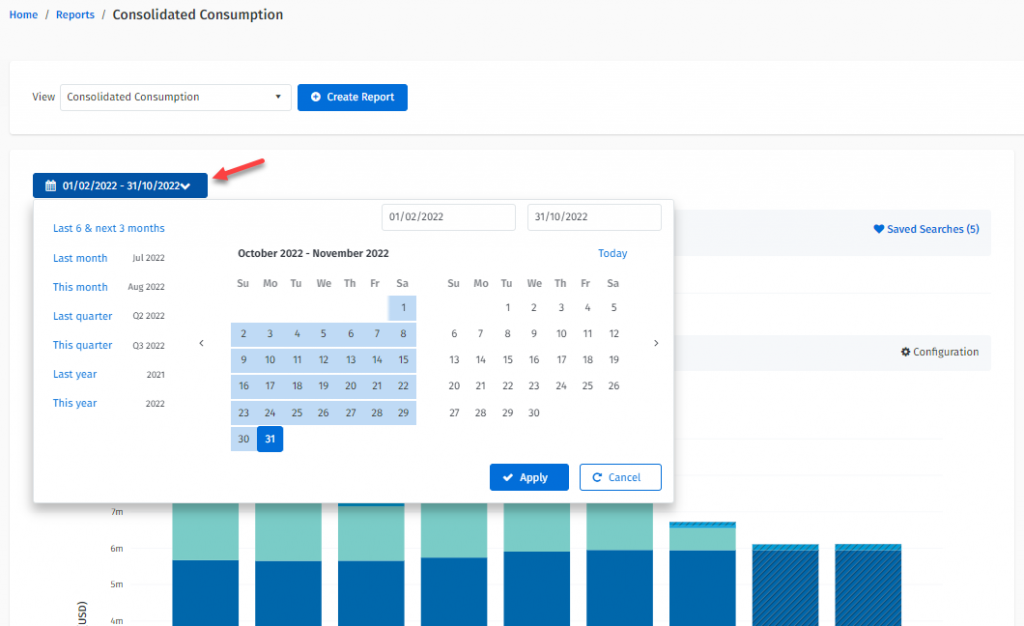
The reset option sets the date range back to default. The default is 6 months back and 3 months forward from today’s date. The default time range adjusts to meet the first and last day of the month.
The AzureSimple Billing Consumption Details allows you to choose date ranges reflecting billing cycles instead of a start and end date.
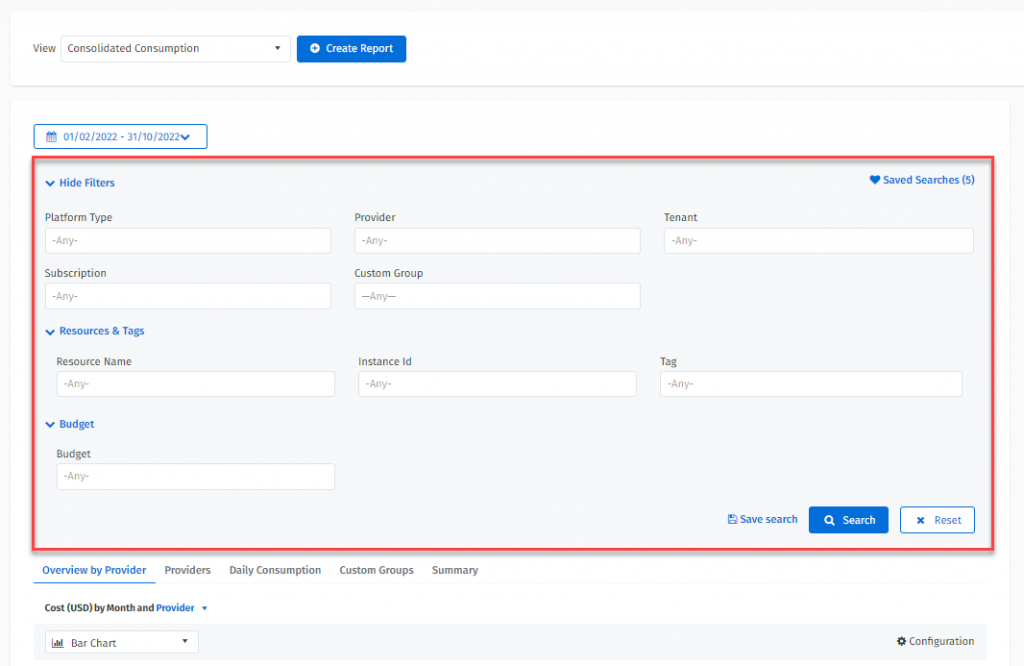
Advanced Filtering: Each report provides users with the ability to filter data. The set of filters (depending on the available report data characteristics) available in the section shown below, allows users to select specific filter values and narrow down the report to the data they want.
Choosing the currency
If a report provides consumption cost, then the currency of that cost is the currency defined in Budgets. The default currency is USD. To change the currency for all reports select the preferred currency from the list of available currencies.
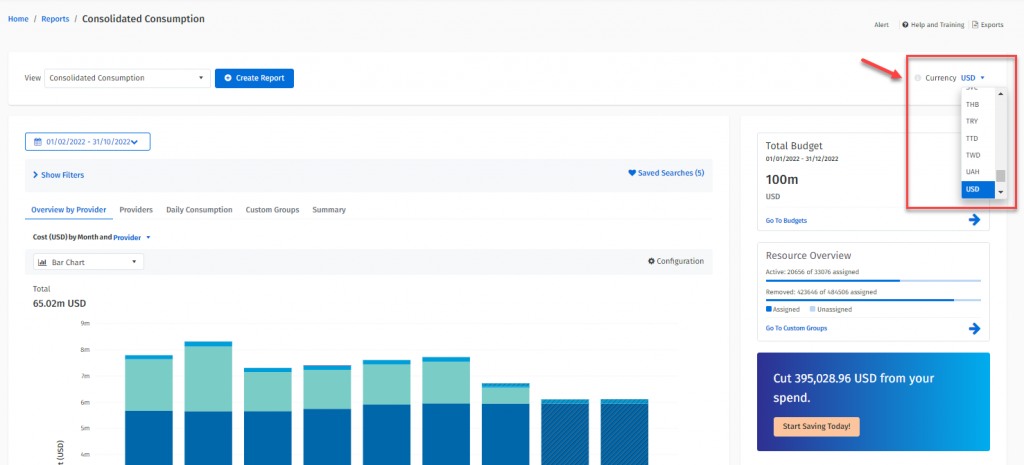
If the currency selected is a different currency from the billing currency – the most up-to-date exchange rates are applied. The exchange rates are updated daily by SoftwareOne using an external public rate source.
Working with the software assets
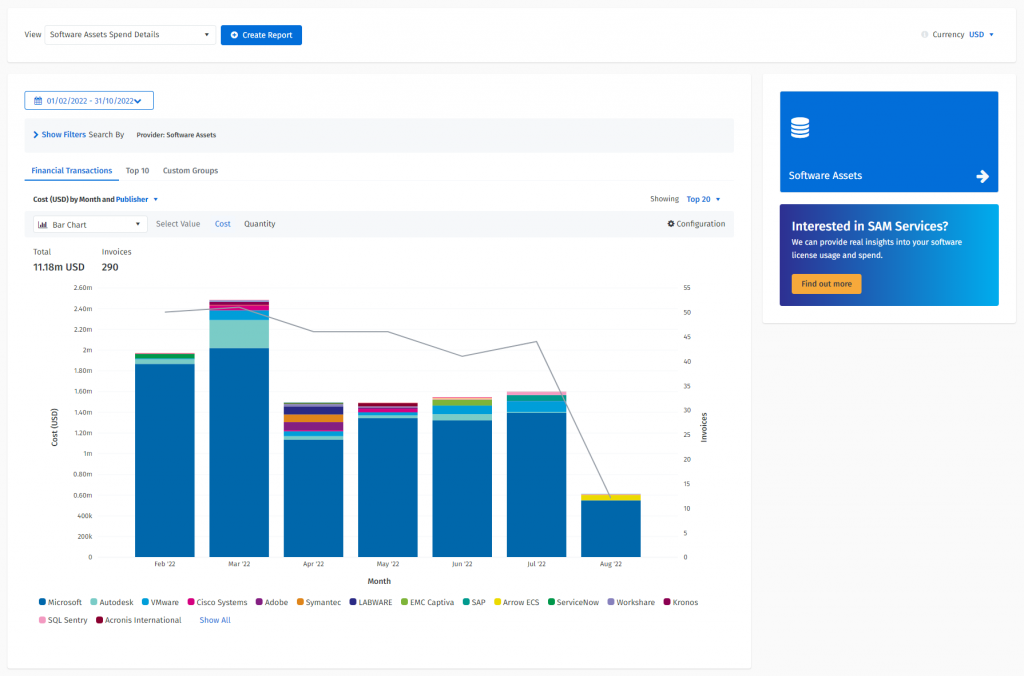
You can visualize and analyze your software assets spend. Each transaction is treated like a resource. You can assign it to a custom group, add tags or split the quantity between different business units (the same way you can with cloud resources). You can read how to enable transactions by going to Software Assets On-boarding.
Transactions can be viewed separately in the report we designed for that purpose: Software Assets Spend Details or along with cloud resources using our consolidated report.
Metric selections
To give you flexibility, you can decide if you want to view your transactions by cost or quantity.
Predictions
There is built-in integration with Renewal Manager. This enables you to visualize your future software assets spend by connecting your transactions to planned renewals.
Consolidated view
You can also view your transaction and cloud costs within Consolidated Reports.
Analytic capabilities
You can view your transactions by:
Publisher
Product Family
License Model
Document Type (Invoice or Credit Memo)
PO Numbers
User-defined resources
You can analyze the cost of the virtual resources that you manually added to the platform (see Resources). You can do this separately or combined with your provider costs.
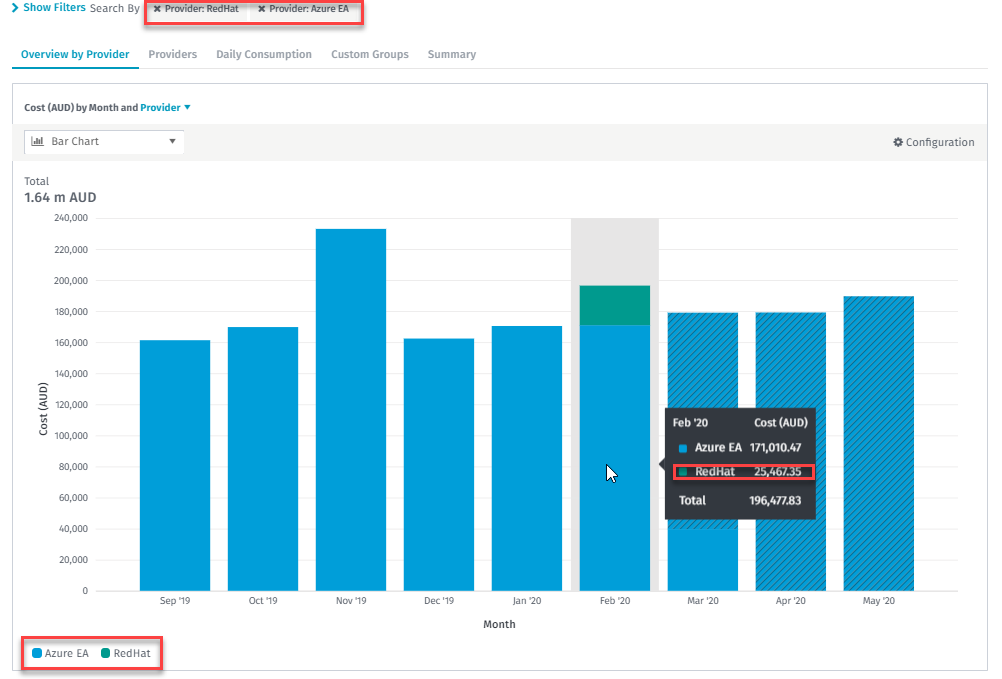
To do so, open the Consolidated Consumption report from the dropdown. Virtual providers can be accessed using the Provider filter in the Consolidated Consumption report. To select the virtual provider, first expand the filter section and then select the virtual provider you added in Resources as shown below:
The virtual resource costs are treated the same as any other resource costs (such as Azure or AWS). You can analyze the cost of the virtual provider on its own.
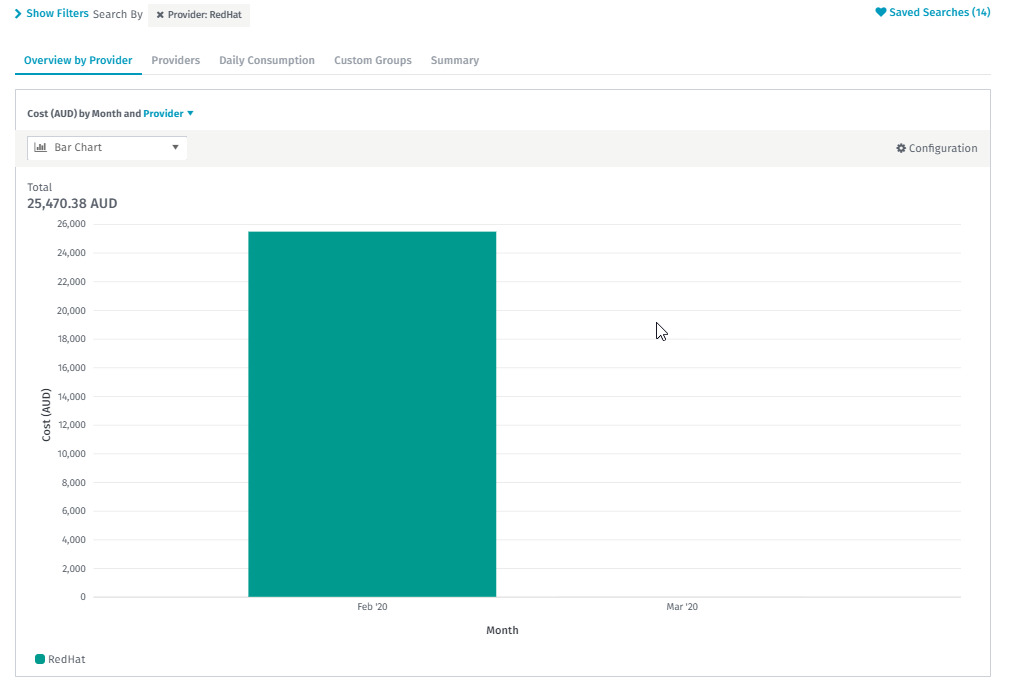
Or in combination with your resource costs.
Exporting the data
Most of the reports provide a list of consumption cost for each resource on the last page (within the date range you specified in the Date Filter). This detailed table can be exported to an Excel file.
To export the file, select Export and save the generated file on your system.
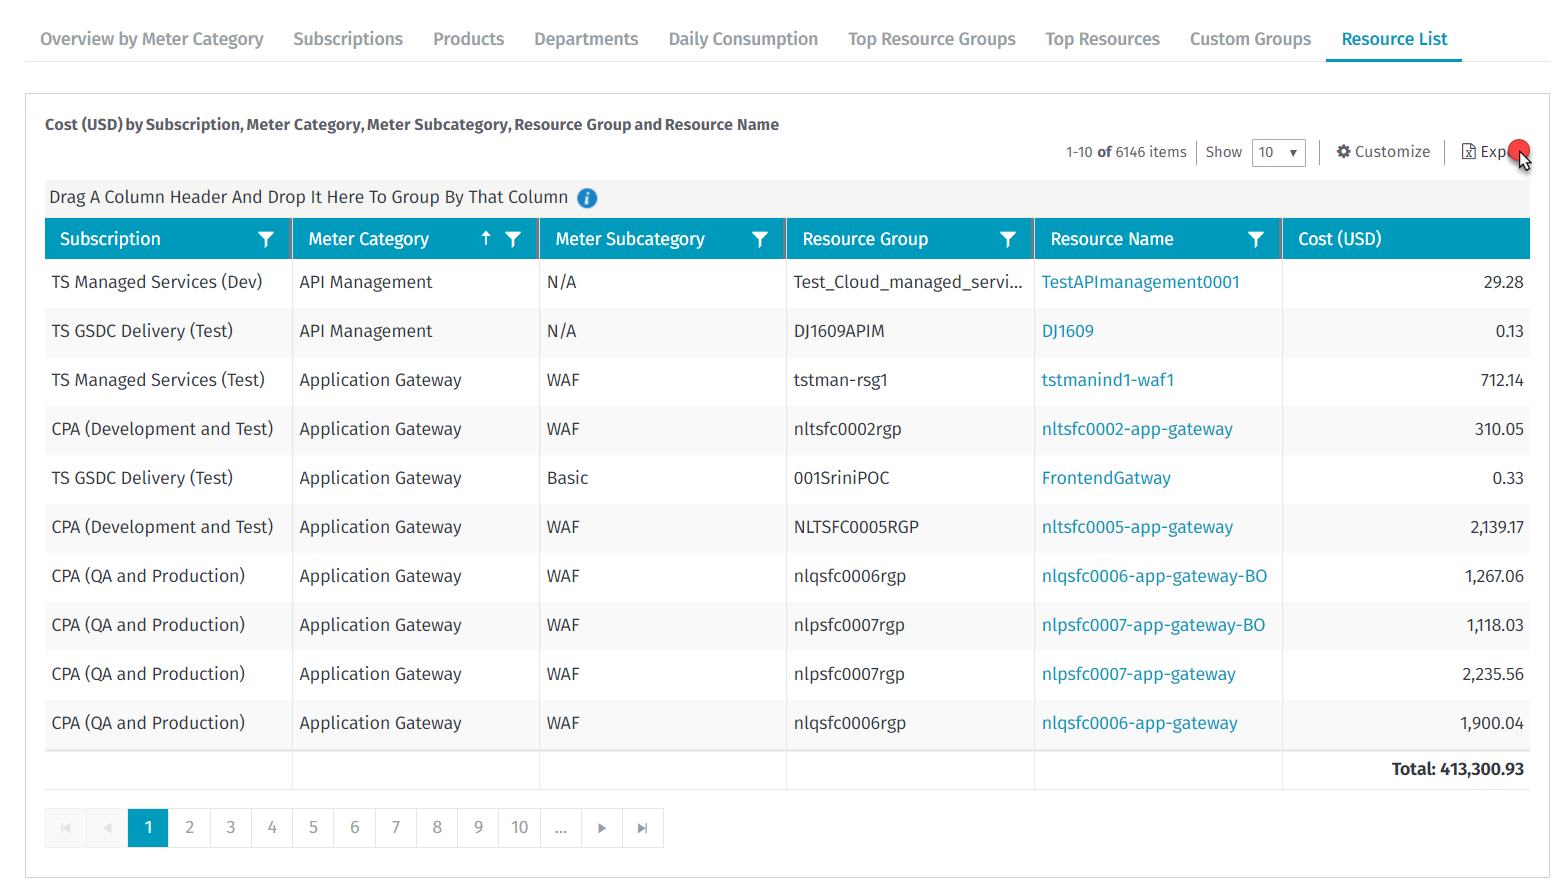
The file generated is compliant with the list of columns provided in the details table. Customize table columns before exporting to adjust the list of columns in the generated file.
Was this helpful?