Customized Spend Reports
With the new reporting capability, you can create multiple custom views and aggregate them into a simple dashboard experience.
Creating custom reports
To create a custom executive report:
From the main menu, navigate to Cloud tools > Consumption Overview.
Select Executive Report and then select Add your Report to create your custom report.
Enter a name for your new report. The name can be changed later if needed.
The report with aggregated Provider data will be added to your new Executive Report.
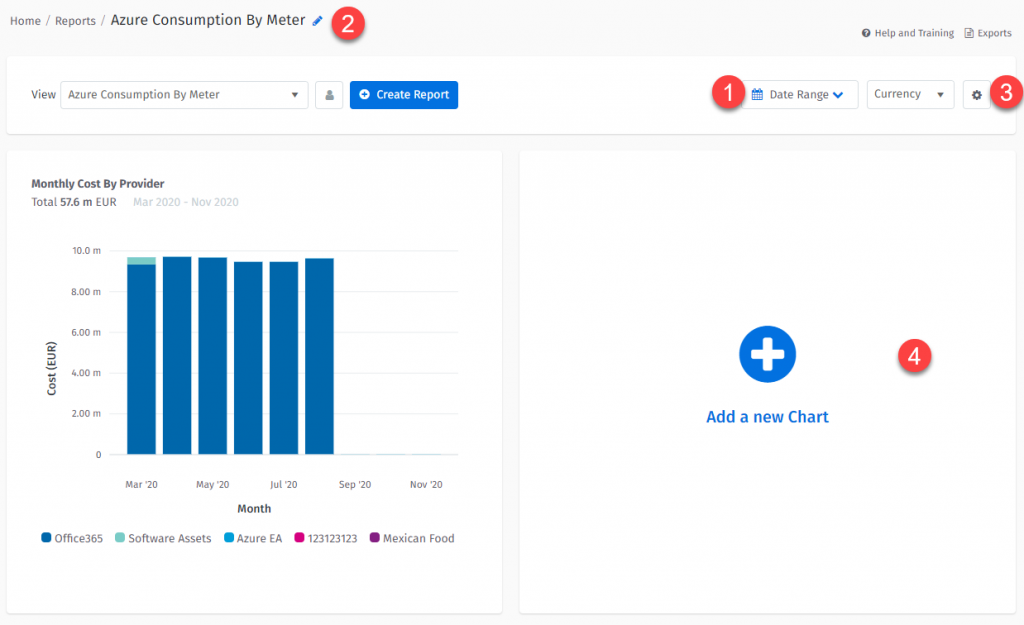
You will also see spaces with a “plus icon” (4). Clicking on the plus icon allows you to quickly add new data that is of interest to you.
Each element has its filters and grouping – including date range. You can override dates, grouping, and currency in the report context to align all elements.
Dates, grouping, or currency overrides are not saved. So when you open the report again it will present data in the default state.
Only time-based elements will be affected by grouping changes. Elements with a custom “X” axis will ignore this setting.
You can delete a report by selecting the cog icon (3) and selecting Delete report. Once you confirm this action the report will disappear from the drop-down.
Similarly, you can edit the report name by clicking on the pencil icon. All changes made in the report are auto-saved.
Reordering elements
To rearrange the elements:
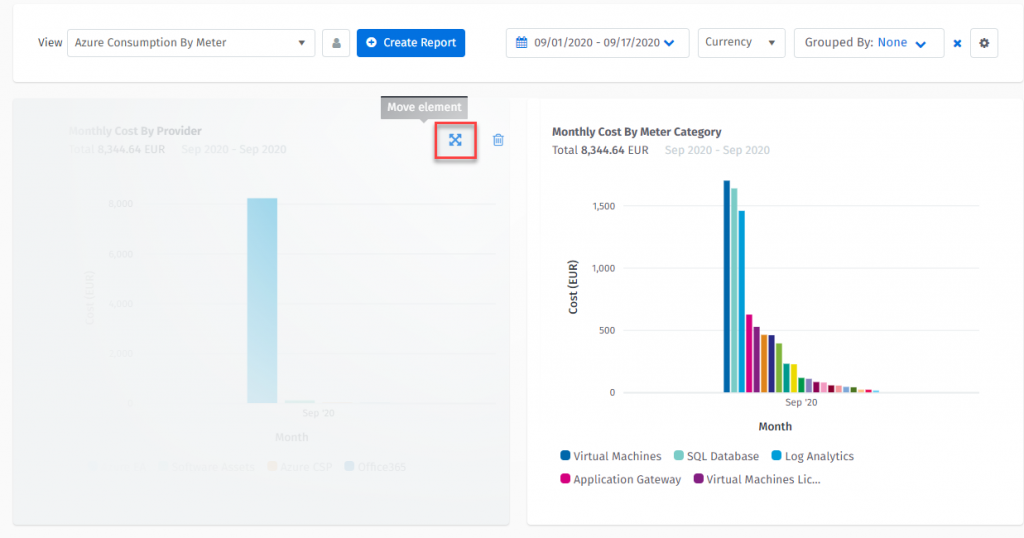
Hover over the element you want to move until you see the cross/arrow icon appear.
Click on that icon and drag the element to the area you want to move it to.
Deleting elements
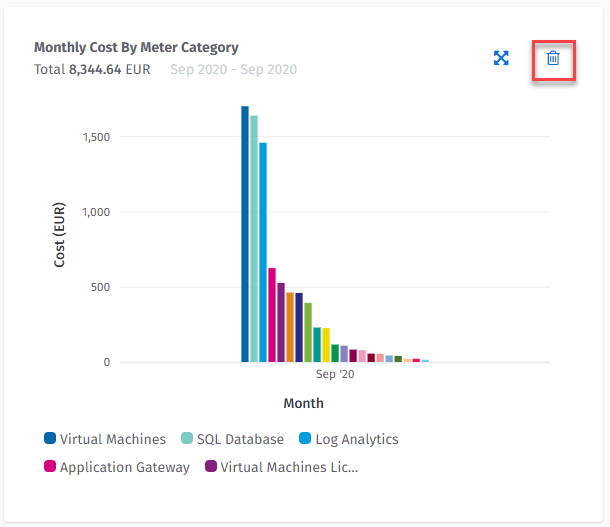
You can remove elements by hovering over the element until you see the bin icon appear. Select the bin to delete the element.
Using the edit mode
To enter the edit mode, click anywhere on the chart element.
Configuring elements
In the configuration section, you can define your data and pick your preferred presentation option.
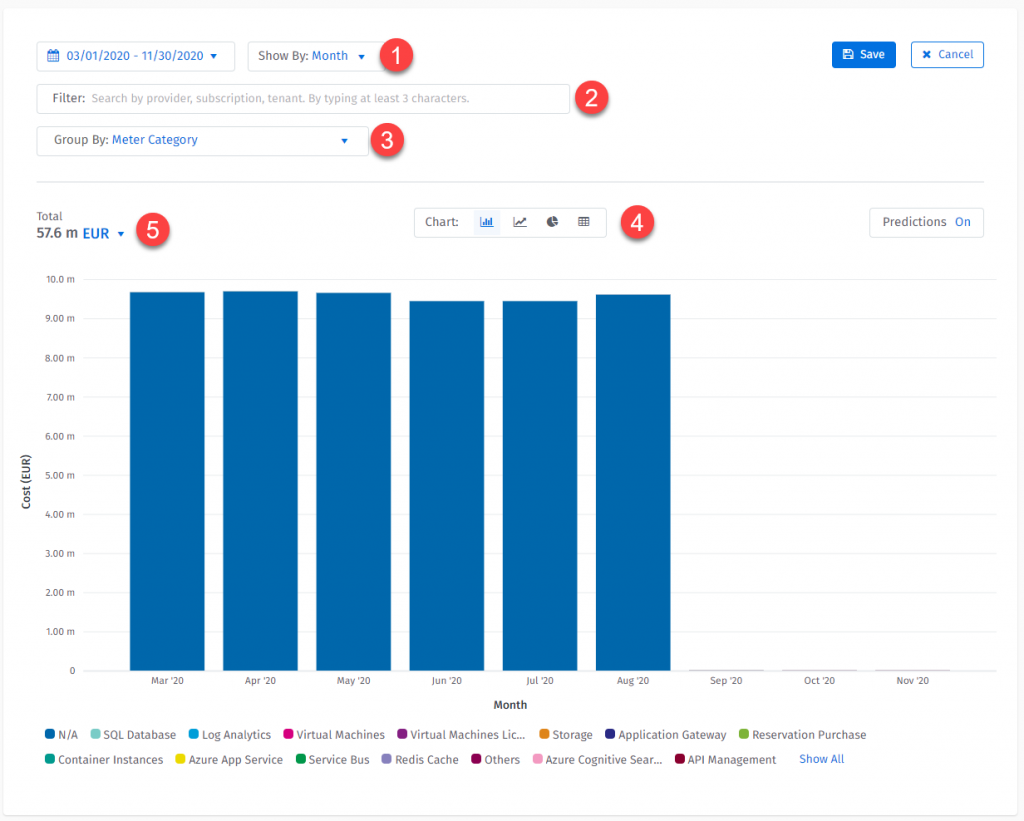
You can control data displayed on the “X” axis in the “Show By:” drop-down (1). Available options are Day, Month, and None.
The Day and Month settings will make the “X” axis time-based. However, None will render the value selected in the “Group by” section (3).
Advanced filtering
Reports support advanced filtering (2). This scans through all your data providers (e.g. Azure / Software Assets / Virtual) and provides you with a unified search experience.
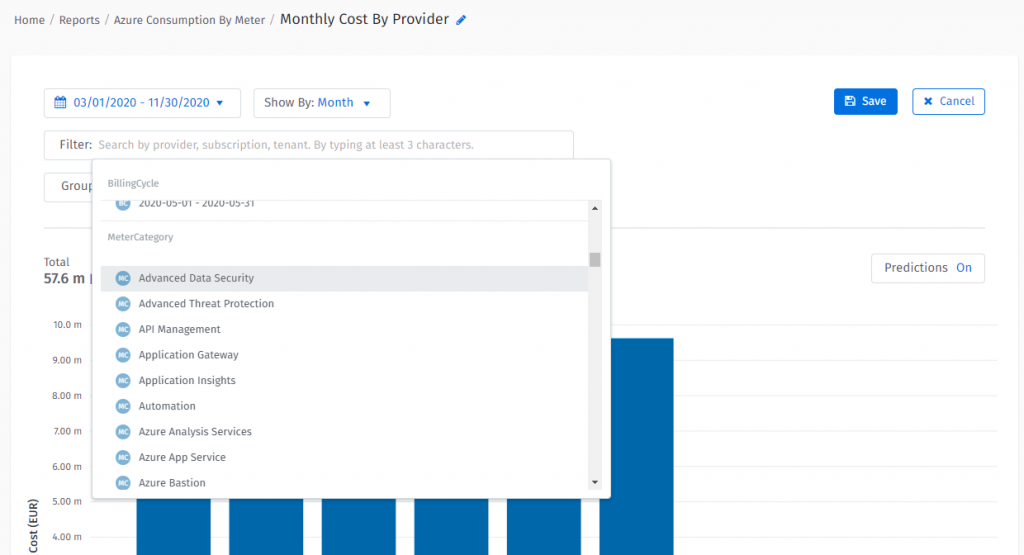
Search index breaks words by space or “-” character and uses “starts with operator” for each word. For example: for resource my-test-vmineurope if you type “test”, the index will find this resource. However, if you type “est” this resource will not be found.
By clicking the hierarchy icon (4) you can refine your custom group search using the tree structure. The changes made in the custom group selector are reflected in the filter control and vice-versa.
Grouping Selector
There are many grouping options. Availability depends on the providers you have activated (3).
Chart Type Selector
Depending on your business use case you can choose different presentation layers for your data (4), available options are:
Line (perfect for daily time series)
Bars (ideal for categories, for example, MeterCategory)
Pie (the best for summaries, for example, Providers)
Table (in all listings, for example, Resources)
Currency Selector
Each element can have a different currency. By default your budget currency is selected. However, you can change it at any time (5)
Sharing executive reports
Executive Reports support quick share functionality. You can easily share your report with your colleagues by following the steps below.
Sharing a personal report
To share a personal report, select the report you would like to share from the report selection, and click Share.

Next, select members from your account. Allowed roles are Can view and Can edit. Users with the Can Edit role can also adjust the sharing list with limitations to the Owner role.
Exporting executive reports
You can export an executive reports to a PDF. To export a report, select your report from the report selector and select Exports.
Last updated
Was this helpful?